Bitcoin Price Prediction for May 27, 2026: Will it Hold at $76.5K or Crash to $75K?
2026-05-26
Bittime - Bitcoin currently trading at $76,737, down 0.87% in the last 24 hours.
Prices moved in a range of $76,478 to $77,866, with 24-hour volume reaching 103 BTC (approximately $7.98 million) on Bittime.
Big question: will Bitcoin be able to hold above the $76,478 support, or will it break towards $75,000?
Here is the Bitcoin price prediction for May 27, 2026 based on latest market data and technical indicators.
Key Points
Bitcoin current price is $76,737 – Down 0.87% in 24 hours. Nearest support is at $76,478, and resistance is at $77,866.
Technical indicators show bearish potential – MACD histogram is negative, Stoch RSI is in the oversold zone, EMA indicates selling pressure.
Key levels to monitor – If $76,478 is broken, the next target is $75,000. If it holds, there's a potential rebound to $77,500-$78,000.
Register at Bittime now and start trading crypto with a fast, safe, and easy process in the app.
Current Bitcoin Price and 24 Hour Movement
Based on Bittime real-time data (May 26, 2026):
BTC to USDTvia Bittime Market
Price: $76.737,09
24 hour changes: -0,87%
24 hour high: $77.866,50
Lowest price 24 hours:$76.478,67
Volume 24 jam (BTC): 103,25 BTC
Volume 24 hours (USDT):$7.98 million
Bitcoin is currently moving below its opening level.
The price range of $76,478 - $77,866 indicates moderate volatility.
From the order book data, buyer support is seen in the $76,730 - $76,740 area with a fairly thick buy wall accumulation.
Meanwhile, the sell wall is thinner on the upside, indicating a potential breakout if buying pressure increases.
Read also:How to Buy Bitcoin (BTC) Using USD on Bittime
Technical Indicator Analysis
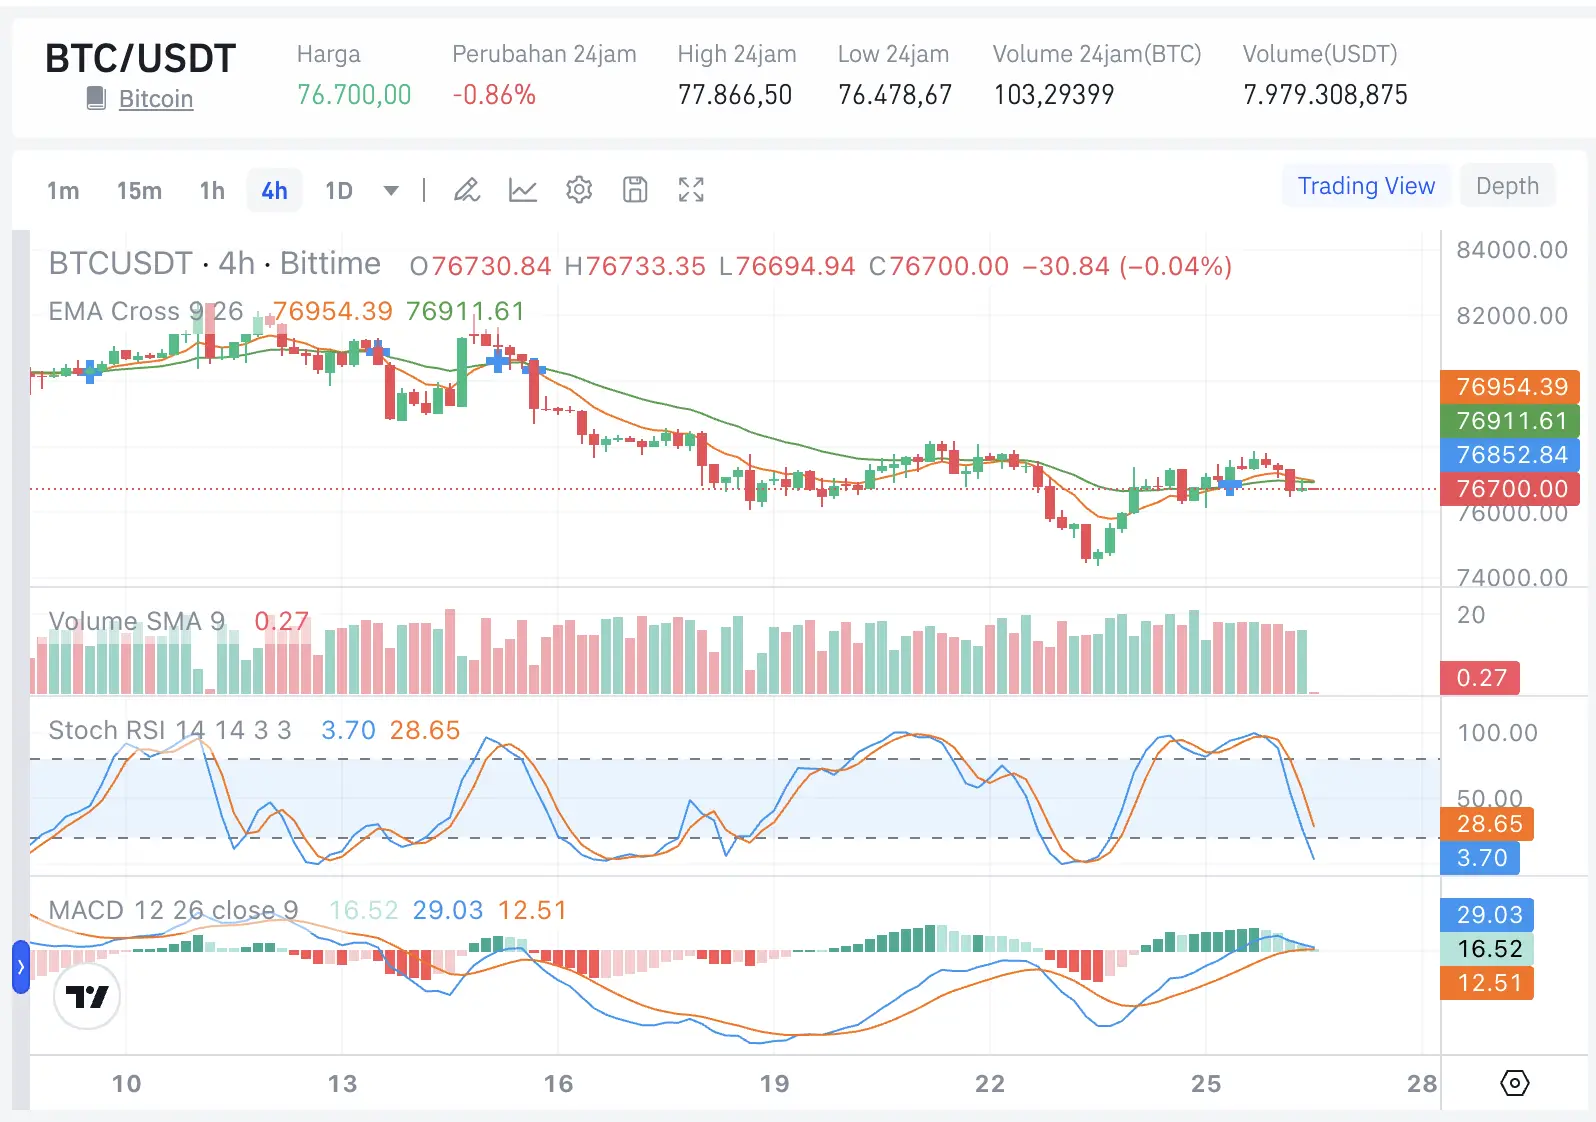
Referring to the 4-hour BTC/USDT chart on Bittime, here are the current technical indicators:
EMA (Exponential Moving Average)
The current price ($76,737) is below both EMA lines (the 926 EMA at $76,954 and the other EMA at $76,911). This is a bearish signal as the price is trading below the major moving averages.
MACD (Moving Average Convergence Divergence):
MACD line: 16,52
Signal line: 29,03
Histogram: -12.51 (negative)
MACD Histogram Negative
This indicates that bearish momentum remains dominant. However, the divergence between the MACD line and the signal line is not very wide, indicating a potential reversal if buying pressure intensifies.
Volume
The SMA 9 volume is at 0.27, indicating relatively normal trading activity. There are no significant volume spikes that would indicate panic selling or buying frenzy.
Stochastic RSI
The Stochastic RSI value is at 3.70 (oversold) and 28.65 for the other line. This is a strong oversold signal. In many cases, oversold signals indicate a potential rebound in the near future.
Support dan Resistance Bitcoin
Critical support level (buyer zone)
Nearest support: $76.478 (low 24 jam)
Strong support: $76.000 - $76.200
Support mayor: $75.000
From the order book, the accumulated buy wall is seen in the area of $76,730 - $76,740.
If this level holds, Bitcoin has the potential to rebound.
Critical resistance level (seller zone)
Nearest resistance: $77.000 - $77.200
Strong resistance: $77.866 (high 24 jam)
Resistance mayor: $78.500
The sell wall above is thinner than the buy wall, making it easier for an upward breakout to occur if there is a positive catalyst.
Read Also: What's the Difference Between BTC IDR and USDT? A Complete Guide for Beginners
Bitcoin Price Scenario Prediction for May 27, 2026
Bullish scenario (40% probability)
If Bitcoin manages to hold above the $76,478 support line and is driven by the oversold Stochastic RSI (3.70), a rebound could occur. Immediate targets: $77,500 - $77,866. If $77,866 is broken, the next target is $78,500.
Neutral Scenario (40% probability)
Bitcoin is moving sideways within the $76,500-$77,500 range. The oversold Stochastic Relative Strength Index (RSI) is preventing further declines, but bearish EMAs and negative MACD are limiting gains.
Bearish Scenario (20% probability)
If the $76,478 support level breaks, Bitcoin could potentially test the $76,000 level. If $76,000 doesn't hold, the next target is $75,000 (a psychological level). Current low volume reduces the likelihood of a major sell-off, but negative sentiment could accelerate the decline.
External Factors that Influence
Some external factors to consider:
The Fed's interest rate policy: The market is still digesting the Fed officials' statement on interest rates.
Bitcoin ETF Development: Institutional cash flows remain the main driver.
Global market sentiment: The DXY index and oil prices influence investors' risk appetite.
Convert 1 BTC to IDR - Bitcoin to Indonesian Rupiah Exchange Rate
Conclusion
Bitcoin price prediction May 27, 2026: Bitcoin is currently trading at $76,737 with key support at $76,478 and resistance at $77,866.
Technical indicators show a mixed picture. The Stochastic Relative Strength Index (RSI) is at 3.70 (oversold), indicating a potential rebound. However, the negative MACD histogram and the price below the EMAs indicate continued bearish pressure.
Most likely scenario: Bitcoin will move sideways between $76,500 - $77,500 with a tendency to test resistance.
If the $76,478 support breaks, the door to $75,000 opens.
If it holds and is pushed oversold, a rebound to $77,500 - $77,866 is very possible.
Key levels to monitor: $76,478 (support) and $77,866 (resistance). A breakout of either level will determine the next direction.

Monitor Bitcoin Price Movements on Bittime. Bittime is Digital Financial Asset Trader (PAKD) platform licensed and supervised by the Financial Services Authority —where you can buy Bitcoin in Indonesia and hundreds of other crypto assets starting at IDR 10,000. Registration is fast, secure, and can be started today.
Monitor conversions USDT to IDR and real-time price movements of your favorite crypto assets. All available in one place. crypto investment app which can be downloaded for free on the Play Store.
Ready to start? Register now at Bittime and execute your investment strategy with a platform trusted by millions of users in Indonesia.
FAQ
What is the price of Bitcoin today?
$76,737, down 0.87% in 24 hours. Range: $76,478 - $77,866.
What is Bitcoin's nearest support?
$76,478 (24-hour low). If it breaks, the target is $76,000, then $75,000.
What is Bitcoin's nearest resistance?
$77,866 (24-hour high). If broken, the target is $78,500.
What is the signal of Stoch RSI?
3.70 (oversold). This indicates a potential short-term rebound.
What is the signal from MACD?
The histogram is negative (-12.51), indicating that bearish momentum is still dominant.
Disclaimer: The views expressed belong exclusively to the author and do not reflect the views of this platform. This platform and its affiliates disclaim any responsibility for the accuracy or suitability of the information provided. It is for informational purposes only and not intended as financial or investment advice.

.png)