Latest Bitcoin Price Prediction for March 22, 2026
2026-03-21
USDT/IDR has once again shown interesting price movement today, March 21, 2026. Based on the USDT/IDR 4-hour chart on Bittime, the USDT price is still moving in a sideways to mildly bullish pattern with fairly neat consolidation above the middle Bollinger Bands area.
Daily price analysis remains important for reading short-term trend direction, especially when the price approaches new resistance. Although USDT/IDR tends to be more stable than volatile crypto assets such as BTC, understanding support levels, resistance, Bollinger Bands, Stochastic RSI, and MACD remains the key to making more measured decisions.
In this article, we review USDT/IDR’s latest price performance, technical analysis, and the predicted USDT price movement for March 22, 2026 based on the latest market data and charts from Bittime as of March 21, 2026.
Key Takeaways
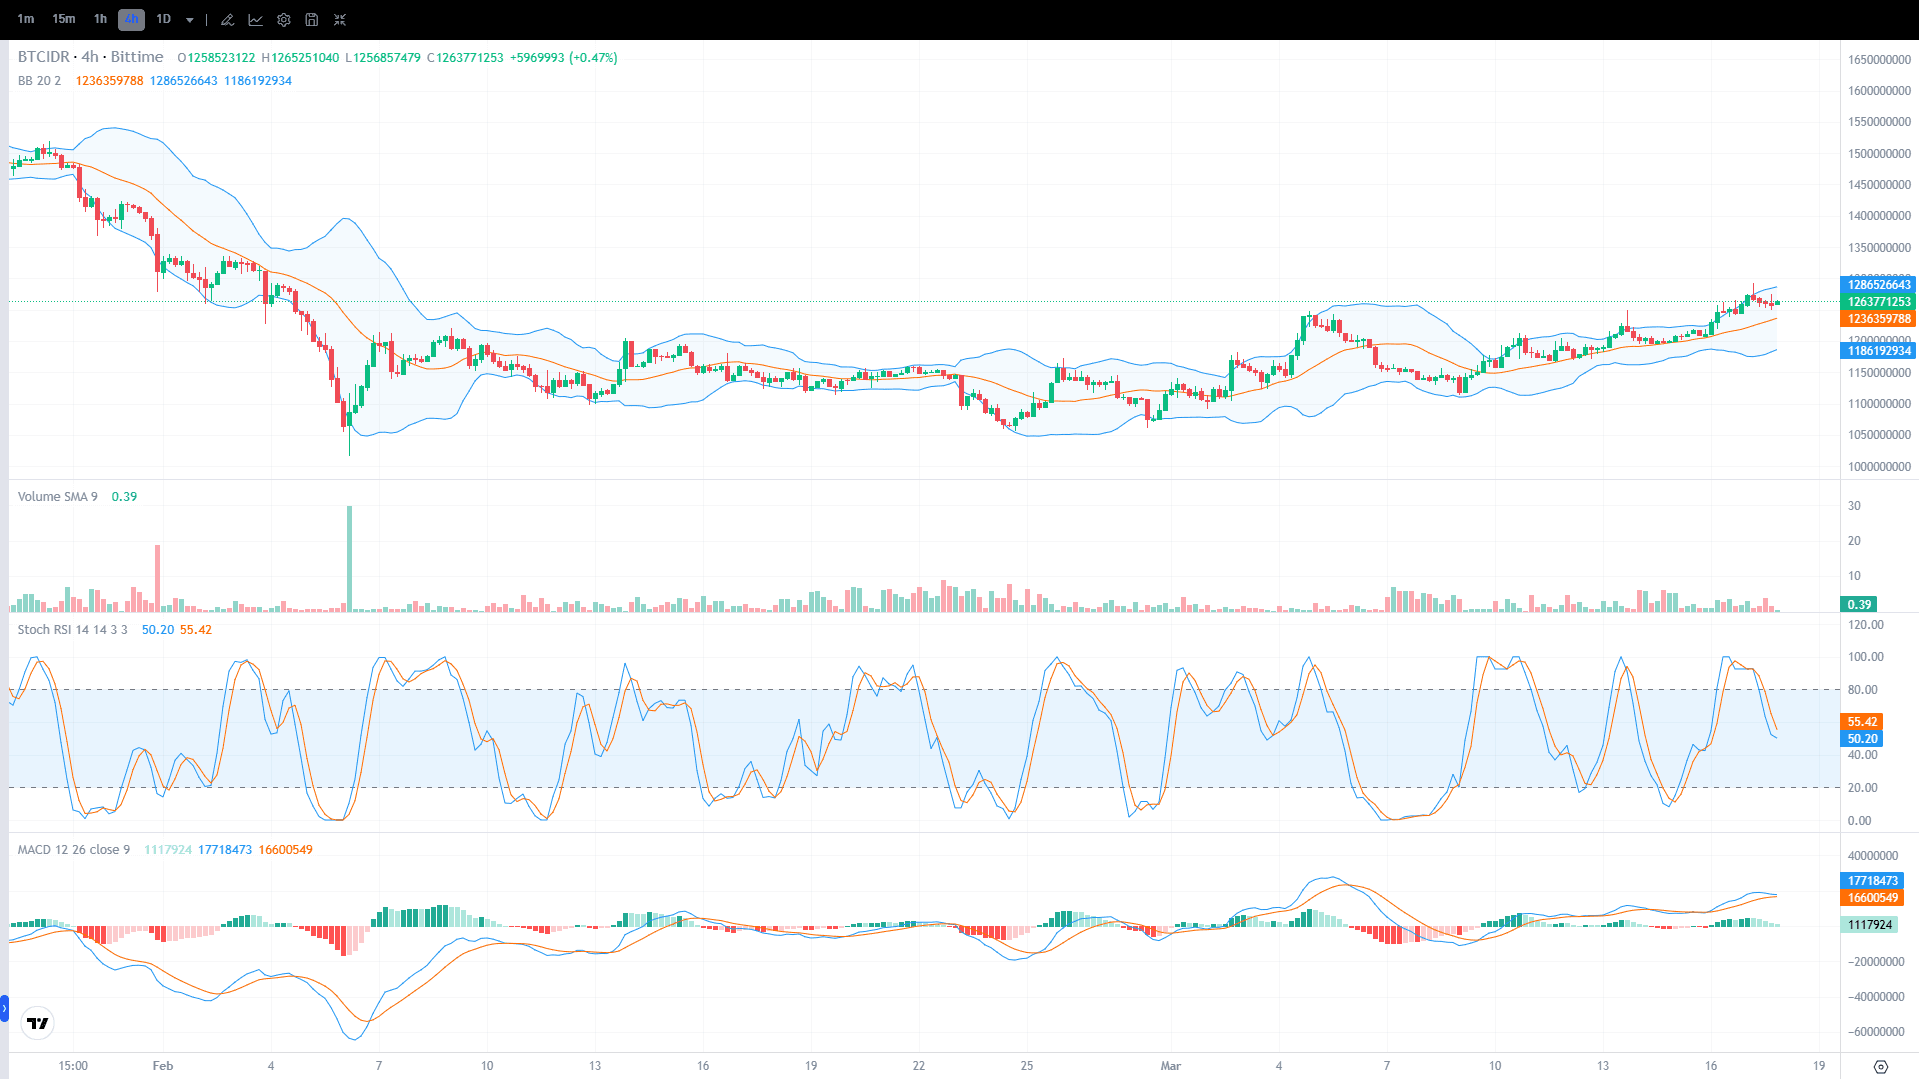
- USDT/IDR is currently moving in the Rp17,050 – Rp17,092 range and last closed at around Rp17,072.
- The nearest resistance is in the Rp17,092 – Rp17,108 area, while important support is at Rp17,047, followed by lower support around Rp16,986.
- As long as the price stays above the middle Bollinger Bands area at Rp17,047, the short-term trend still leans neutral to positive. However, if this level breaks, the correction could widen to Rp17,000 – Rp16,986.
Track the latest USDT price and start trading USDT/IDR easily through the Bittime platform right now.

Register on Bittime now and start trading crypto with a fast, secure, and easy process in the app.
USDT Price Performance Today
Here is a brief overview of USDT/IDR price movement based on the 4-hour timeframe chart:
Note: Prices may differ across exchanges due to differences in liquidity, spread, and market order book depth.
Read Also: Dolomite (DOLO) Price Prediction: Trend & Sentiment Analysis
Historical USDT Price Movement
Over the past few weeks, USDT/IDR has tended to move more steadily than volatile crypto assets. On the 4-hour chart, movement from late February to mid-March shows a dominant consolidation pattern with a slight upward bias during several phases.
The price has fluctuated several times within the Rp16,800 to Rp17,100 range, with one brief spike that did not continue into a new trend. After that, USDT returned to normal movement and is currently able to hold above the middle Bollinger Bands area.
Overall, the current price structure is still considered healthy for a stablecoin pair because the latest candles are holding above the medium average area, although the momentum is not yet strong enough for an aggressive breakout.
Read Also: Polyhedra Network (ZKJ) Price Prediction: Short to Long Term
USDT Price Analysis Today – March 21, 2026
USDT/IDR is currently moving in a sideways to mildly bullish pattern near the upper Bollinger band area. The latest closing price around Rp17,072 is still above the Bollinger Bands middle line at Rp17,047, indicating that the short-term trend remains relatively stable with a slight positive bias.
However, in terms of momentum, the market is still not very strong. The Stochastic RSI values of 15.11 and 21.87 are in the lower area, showing weak momentum but also opening the possibility of a technical rebound if an upward crossover occurs in the next session.
On the other hand, the MACD indicator shows momentum that tends to be neutral to weak. The MACD line at 24 is slightly below the signal line at 25, while the histogram is around -2. This shows that upward pressure is still being held back, although there is not yet a strong bearish signal as long as the price remains above the main support.
As long as USDT is able to hold above the medium support area and does not lose its Bollinger Bands base, the opportunity to retest the upper resistance remains open. But if selling pressure increases, this pair will likely move sideways in a narrower range again or experience a mild correction first.
Key USDT/IDR Levels
Nearest resistance: Rp17,092 – Rp17,108
Strong support: Rp17,047 – Rp16,986
The Rp17,092 area is the very nearest short-term resistance because it represents the latest candle peak, while Rp17,108 is the upper band that may become the next barrier. Meanwhile, the Rp17,047 area is a very important dynamic support for keeping the price structure stable.
USDT Price Prediction for March 22, 2026
The predicted USDT price on March 22, 2026 is expected to move within the Rp17,047 – Rp17,108 range, with the initial tendency still sideways to mildly bullish as long as the price stays above the middle Bollinger Bands area.
If buying pressure increases again and the candle manages to break through Rp17,092, then USDT/IDR has the potential to test Rp17,108. If the breakout is valid and supported by improving volume, the movement could extend slightly above that area.
On the other hand, if short-term weakness occurs, the price may first fall to the Rp17,050 – Rp17,047 area. If this support fails to hold, the risk of a broader correction toward Rp17,000 to Rp16,986 will increase.
Read Also: Obol (OBOL) Price Prediction: Short, Medium, and Long Term
Factors Affecting the USDT Price
For short-term movement, USDT/IDR is still heavily influenced by a combination of technical structure, market sentiment, and demand dynamics for stablecoins in the local market.
Price Position Relative to Bollinger Bands
A price that is still above the middle Bollinger line shows that the stable to positive bias remains intact. However, the relatively close distance to the upper band also indicates that upside room tends to be limited unless new volume support appears.
Stochastic RSI
The Stochastic RSI being in the lower area shows that momentum is still weak. However, this condition can also become an early rebound signal if the indicator lines begin to turn upward and exit the low zone.
MACD Tends to Be Neutral-Weak
The MACD being slightly below the signal line shows that upward momentum is not yet very strong. As long as the gap remains thin and the price has not fallen below the main support, this condition reflects consolidation more than a full bearish trend.
Read Also: Maduro Memes (MADURO) Price Prediction: Chart Analysis and Its Potential
Potential Scenarios
Bullish Scenario
If USDT/IDR is able to break above Rp17,092 and then move steadily above that level, the next upside target is around Rp17,108. This scenario will become stronger if supported by continued green candles and increasing volume.
Sideways Scenario
If the market does not yet have a new driver, USDT/IDR has the potential to move flat within the Rp17,047 – Rp17,092 area. This scenario is quite realistic because Stochastic RSI is still low and MACD has not yet given a firm upward push.
Bearish Scenario
If the price falls below Rp17,047, then selling pressure could increase and push USDT/IDR toward the Rp17,000 area. If the weakness continues, the lower Bollinger support around Rp16,986 becomes the next correction target.
Conclusion
USDT/IDR on March 21, 2026 still shows a fairly stable short-term market structure, with the price above the Bollinger Bands middle line. Even so, the still-low Stochastic RSI and slightly negative MACD signal that upward momentum is not yet very strong and the market remains vulnerable to sideways movement.
For the March 22, 2026 prediction, the Rp17,092 area becomes the key breakout level, while the Rp17,047 area is the support that must be defended. As long as that support holds, the opportunity for an increase toward Rp17,108 remains open. However, if support breaks, a deeper correction needs to be watched.
How to Buy Crypto on Bittime?

Want to trade, buy, and sell buy USDT and invest in crypto easily? Bittime is ready to help! As an Indonesian crypto exchange officially registered with Bappebti, Bittime ensures every transaction is safe and fast.
Start by registering and verifying your identity, then make a minimum deposit of Rp10,000. After that, you can immediately buy your favorite digital asset!
Check the USDT to IDR, ETH to IDR, SOL to IDR and other crypto assets to find out today’s crypto market trends in real time on Bittime.
In addition, visit Bittime Blog to get various interesting updates and educational information about the crypto world. Discover trusted articles about Web3, blockchain technology, and digital asset investment tips designed to enrich your knowledge in the crypto space.
FAQ
What are the main indicators visible on the USDT chart for March 21, 2026?
The main visible indicators are Bollinger Bands, Stochastic RSI, and MACD. All three show that the price is still relatively stable above dynamic support, but upward momentum is still limited.
Why is the Rp17,047 area important for USDT/IDR?
Because that area is the Bollinger Bands middle line, which is currently functioning as dynamic support. As long as the price remains above this level, the short-term price structure is still considered stable.
Does USDT still have the potential to rise again on March 22, 2026?
That possibility still exists as long as the price can hold above the main support and break through the nearby resistance at Rp17,092. If a breakout occurs, the nearest target points to Rp17,108.
Is a bearish signal already clearly visible?
Not yet very strong. What is currently more dominant is weakening momentum, not a full trend reversal. The bearish signal will become more valid if the price falls below Rp17,047 and MACD weakens more clearly.
How can you monitor USDT price movement in real time?
USDT prices can be monitored through crypto trading platforms, exchange apps, or chart services that provide direct USDT/IDR updates along with technical indicators.
Disclaimer: This content is for educational and informational purposes only. We are not financial advisors. Crypto investment carries high risk and may result in losses. Do your own research before investing. All decisions are the user’s responsibility.
Disclaimer: The views expressed belong exclusively to the author and do not reflect the views of this platform. This platform and its affiliates disclaim any responsibility for the accuracy or suitability of the information provided. It is for informational purposes only and not intended as financial or investment advice.

.png)