Crypto Market Weakens, Why Is BNB More Resilient?
2026-11-11
The crypto market weakened from October 9 to November 7, 2026. Bitcoin, Ethereum, Solana, and XRP all experienced corrections, but BNB followed a different pattern. According to Bittime Research, the BNB price fell by just 5.6% during that period, compared with declines of 7.3% for BTC, 9.7% for ETH, 15.9% for XRP, and 18.5% for SOL.
This difference is noteworthy because BNB managed to outperform the broader market despite selling pressure and concerns surrounding the Binance security incident in late October. Was this resilience supported by BNB's fundamentals, or did it merely reflect a short-term market response? To understand the situation, we need to compare price movements, the characteristics of each asset, and market conditions during the period.
Key Takeaways
- BNB fell 5.6% from October 9 to November 7, 2026, the smallest decline among the five cryptocurrencies compared by Bittime Research.
- Solana and XRP recorded the steepest declines, at 18.5% and 15.9%, respectively, as market sentiment deteriorated.
- BNB Chain's utility and token-burning mechanism are relevant fundamental factors, but neither has been proven to be the main reason for BNB's price resilience.
Why Is the Crypto Market Falling, and What Triggered the Correction?
October through early November 2026 was a difficult period for the cryptocurrency market. The pressure was reflected not only in falling prices among major assets but also in investors becoming increasingly cautious.
According to the Bittime Research report, Crypto Fear & Greed Index fell from 59 to 25. This shift pushed the market into extreme fear, a condition in which anxiety begins to dominate trading decisions.
Several developments weighed on the market during this period, including uncertainty over US interest-rate policy, outflows from crypto ETFs, and the Binance security incident in late October.
When several risks emerge close together, investors tend to reassess their exposure to risky assets. Cryptocurrencies, particularly highly volatile altcoins, can face greater pressure in such conditions.
However, market corrections do not necessarily have the same cause for every asset. Liquidity, investor activity, and the circumstances of individual projects can lead to different price movements.
Why Do Altcoins Often Fall Further?
Bitcoin is usually the main benchmark for assessing the direction of the crypto market. When its price weakens, many altcoins often follow with larger percentage declines.
One possible explanation is the high betacharacteristic, in which an asset's price is highly sensitive to changes in its benchmark market.
High-beta assets may rise faster when market sentiment is optimistic, but they also risk sharper declines when sentiment turns negative.
Nevertheless, this relationship is not absolute. Each token's performance is also influenced by trading activity, liquidity, and developments within its own project.
Read also: CYBER Price Rises Ahead of Token Unlock: What Are the Risks?
Comparing the Performance of BNB, BTC, ETH, XRP, and SOL
How much did major cryptocurrencies differ in their price declines during the correction?
Bittime Research compared five assets using historical data for the same period, from October 9 to November 7, 2026.
Source: Bittime Research, 30-Day Crypto Market Report, covering October 9–November 7, 2026. These are historical figures, not real-time prices.
Among the five assets, BNB recorded the smallest decline. Its performance exceeded Bitcoin's by 1.7 percentage points and Ethereum's by 4.1 percentage points.
The gap was even wider compared with XRP and Solana. Both altcoins experienced percentage declines more than twice as large as BNB's.
This comparison highlights an important point: even when the overall market direction is negative, the level of pressure on individual cryptocurrencies is not necessarily the same.
Is BNB Stronger Than Bitcoin?
In terms of price performance during the research period, BNB was indeed more resilient than Bitcoin.
In market analysis, this is known as relative strength, which means an asset performs better than a comparable asset over a particular period.
However, relative strength does not mean that BNB has stronger fundamentals than Bitcoin overall.
The two assets have different functions and characteristics. Bitcoin is better known as a digital asset with a limited supply, whereas BNB has various uses within the blockchain ecosystem.
Therefore, the 30-day comparison should be understood as a snapshot of market conditions during that period, not a conclusion about which asset is always better.
Read also: SHIB Falls Sharply: Should Holders Sell or Hold?
Why Has BNB's Price Been Relatively More Resilient?
Several characteristics of BNB are worth examining when discussing its performance during the market correction.
Some relate to how the token is used within its ecosystem, while others concern its supply structure and investor responses to industry developments.
However, these factors must be distinguished from direct causes of price movements. Attractive fundamentals do not necessarily explain why a token's price was more resilient during a specific period.
1. BNB's Utility Within the BNB Chain Ecosystem
BNB is not merely an asset traded in the crypto market. It is also used to pay transaction fees, or gas fees on BNB Smart Chain.
Every activity requiring an on-chain transaction, including token transfers and interactions with decentralized applications, incurs network fees paid in BNB.
This function creates a connection between network usage and demand for the token.
If activity on BNB Chain increases, demand for BNB to cover network operating costs may also rise.
Nevertheless, network activity is not the only factor determining price. Purchases to cover transaction costs may occur alongside sales by investors and other market participants.
To determine whether network utility actually supported BNB's resilience in October–November 2026, transaction data and user activity from the same period would need to be compared.
2. BNB Burns and Reducing the Token Supply
BNB has a token-burning mechanism known as BNB Auto-Burn.
Through this program, a portion of tokens is permanently removed from the supply using a formula that considers BNB's price and the number of blocks on BNB Smart Chain.
The mechanism is designed to reduce BNB's total supply until it reaches a target of 100 million tokens.
In addition to Auto-Burn, a mechanism also burns part of the gas fees in real time.
From a tokenomics perspective, reducing supply is relevant because it can affect the number of tokens available over the long term.
However, its impact on price still depends on market demand. Token burns do not guarantee that prices will rise or remain more stable when other cryptocurrencies undergo corrections.
3. Market Reaction to the Binance Security Incident
BNB's resilience is also noteworthy in connection with the Binance security incident that occurred in late October 2026.
According to Bittime Research, BNB temporarily fell by approximately 8% in one day when news of the hack emerged, from around US759 to US697.
That decline shows BNB was not completely insulated from negative sentiment surrounding the Binance ecosystem.
Overall, however, its 30-day correction remained smaller than those of the other four cryptocurrencies in the study.
The report also notes that BNB withdrawals were among the services gradually reopened following the incident.
Although these developments occurred close together, there is insufficient evidence to conclude that the resumption of withdrawals directly caused prices to stabilize.
The supported conclusion is that BNB demonstrated greater relative resilience during the observation period, despite experiencing a sharp decline at one point.
Read also: BUILDon (B) Price Prediction for 2026: Why Is B Coin Rising?
Why Did Solana and XRP Fall Further?
Solana and XRP were at the other end of the comparison. They recorded the largest corrections among the five cryptocurrencies examined by Bittime Research.
These movements illustrate that even large-cap altcoins can experience substantial volatility when market sentiment deteriorates.
Solana: More Sensitive to Changes in Market Sentiment
Solana is known as a blockchain network with a broad range of ecosystem activity, including decentralized applications and token trading.
However, extensive ecosystem activity does not guarantee that SOL will hold its value when investors begin reducing risk.
During the research period, Solana fell 18.5%, a steeper decline than any other major asset in the comparison.
This is consistent with the characteristics of assets that are sensitive to shifts in market sentiment. When risk appetite weakens, prices can move more sharply than Bitcoin's.
Even so, a decline in SOL's price cannot automatically be equated with deterioration in its technology or network adoption.
XRP: Correlation With Bitcoin Draws Attention
XRP also faced substantial pressure, falling 15.9% over the same period.
Bittime Research noted that XRP had a high correlation with Bitcoin during the observation period, making changes in BTC price one relevant factor.
Correlation reflects the tendency of two assets to move in the same direction. However, the strength of that relationship can change as market conditions or asset-specific factors evolve.
For XRP, regulatory developments, investor activity, and liquidity remain other important factors to monitor.
Therefore, the differences in BNB, SOL, and XRP performance are not simply about which asset has a larger community or ecosystem, but also how the market responds to the risks associated with each token.
Read also: WWAR Price Prediction: Can World War Asset Reserve Reach $0.1?
Does Technical Analysis Also Show BNB's Resilience?
The 30-day price comparison provides a picture of BNB's relative resilience. Technical indicators, however, help assess whether short-term pressure has eased or is still ongoing.
According to Bittime Research, BNB's price on November 7, 2026, was below its 20-day and 50-day moving averages but remained above its 200-day moving average.
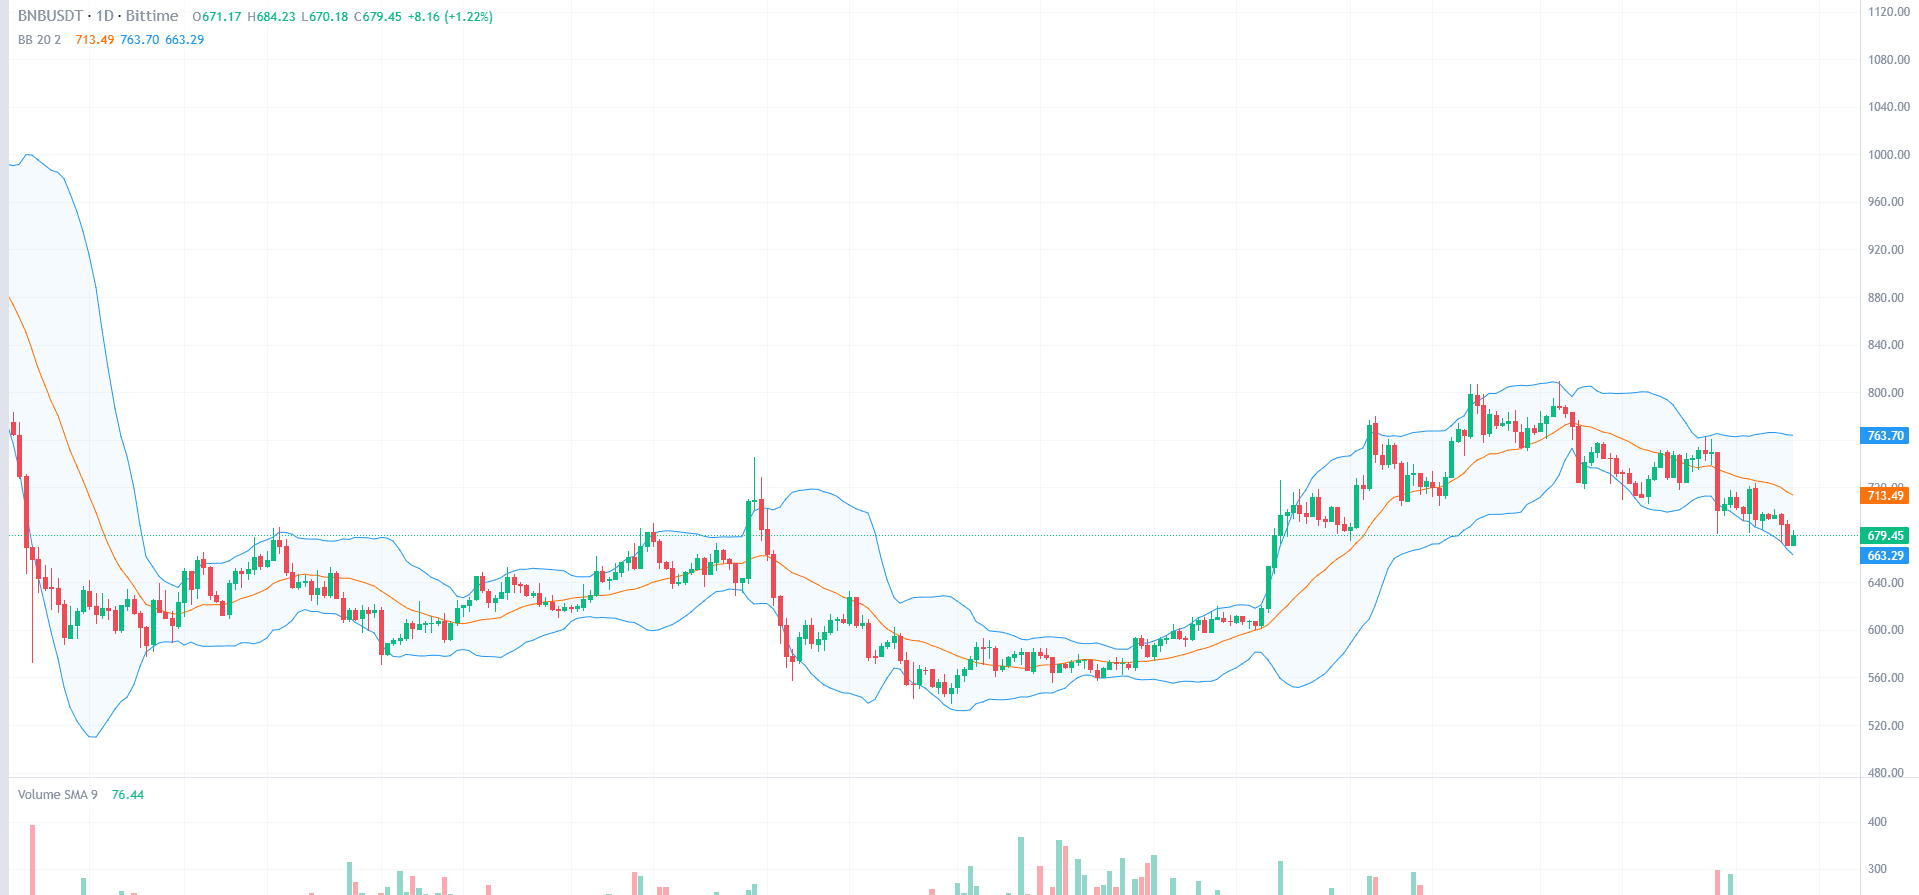
The indicators are summarized below.
Source: Bittime Research, technical analysis based on historical data through November 7, 2026.
Trading below the 20-day and 50-day averages indicates that BNB was still facing short-term pressure.
On the other hand, remaining above the 200-day moving average suggests that its longer-term price structure had not weakened as much as those of some comparison assets.
However, these indicators must be understood in their historical context. Technical levels recorded on November 7 are not necessarily still relevant for trades on subsequent days.
What Does BNB's RSI of 40.8 Mean?
The Relative Strength Index (RSI) is an indicator used to assess the strength of price momentum.
BNB's RSI reading of 40.8 indicates that buying momentum was not yet strong enough to sustain a price increase.
Although the reading was below the midpoint of 50, it had not reached oversold conditions, generally indicated by an RSI below 30.
Thus, price pressure was still evident, but the indicator had not reached the conventional oversold threshold.
RSI should be used alongside price movements and trading volume rather than as the sole basis for predicting a market reversal.
BNB Support and Resistance
Bittime Research identified US$689 as BNB's nearest support level based on the lowest price recorded during the observation period.
Meanwhile, US722 was an initial resistance level associated with the 20-day moving average, followed by the US759 area.
If the price breaks through resistance and sustains its gains, that could be one sign of improving momentum.
Conversely, a decline below support would indicate the need to reassess the price structure.
These are historical reference levels and should be updated using current charts before being applied to trading analysis.
Read also: Collector Crypt (CARDS) Price Prediction for 2026: Can It Still Rise?
What Is BNB's Outlook if the Crypto Market Falls Again?
BNB's comparatively resilient performance during October–November 2026 provides an interesting subject for analysis. However, there is no guarantee that the pattern will repeat if the market comes under pressure again.
Three scenarios can help frame possible future movements.
Scenario 1: The Market Correction Continues
If Bitcoin weakens again and investors continue reducing their cryptocurrency exposure, BNB will remain at risk of further declines.
Outperforming during one period does not make the token immune to shifts in market sentiment.
In this scenario, the strength of support levels, liquidity, and selling activity would deserve close attention.
Scenario 2: The Market Begins to Consolidate
The market may also become calmer after several weeks of pressure.
If buyers and sellers begin to find a balance, cryptocurrency prices may move within a narrower range.
For BNB, consolidation could provide an opportunity to establish a more stable price structure.
However, a sideways phase alone is not enough to confirm that the downtrend is over. A sustained recovery still requires consistent demand.
Scenario 3: Market Sentiment Begins to Recover
If market conditions improve, BNB may benefit from renewed investor interest in crypto assets.
Developments in BNB Chain activity and stronger trading volume may also be additional factors to watch.
Nevertheless, a cryptocurrency that experienced the smallest decline previously will not necessarily record the largest gain when the market recovers.
Price direction will still be determined by prevailing market conditions, not solely by historical performance.
Read also: PAD Coin Price Prediction: Can Public American Dividend Reach US$1?
Risks BNB Investors Should Consider
BNB's relative resilience may be a useful indicator when comparing cryptocurrencies. However, several risks should not be overlooked.
- Market sentiment: BNB is still affected by Bitcoin price movements and conditions in the broader cryptocurrency market.
- Ecosystem dependence: Developments involving Binance and BNB Chain can influence investor perceptions of the token.
- Price volatility: A smaller decline during one period does not guarantee that the price will always be more stable.
- Liquidity risk: Changes in market depth can affect execution prices, especially when trading volume increases sharply.
- Changes in relative performance: The relative resilience rankings of BNB, BTC, ETH, XRP, and SOL can change depending on market conditions.
For investors, comparing price declines is only a starting point.
Decisions should also take into account each asset's utility, project developments, market conditions, and individual risk tolerance.
If you want to follow crypto market developments and compare the performance of different digital assets, you can sign up for Bittime to explore market information, news, and the latest analysis.
What Should Investors Monitor After the Market Correction?
Several developments can help investors assess whether market pressure is starting to ease.
Bitcoin's price movements remain important because the asset has a significant influence on cryptocurrency market sentiment.
Institutional fund flows through ETFs can also provide insight into changing investor interest in the crypto market.
For BNB specifically, BNB Chain activity, developments in token utility, and supply distribution mechanisms are worth monitoring when assessing longer-term fundamentals.
Another important consideration is ensuring that every comparison uses the same observation period.
The most resilient asset over 30 days may not show similar results over daily or weekly trading periods. Conclusions about cryptocurrency performance should therefore always include a clear timeframe.
Conclusion
As the crypto market weakened from October 9 to November 7, 2026, BNB recorded the smallest decline compared with BTC, ETH, XRP, and SOL in Bittime Research's analysis.
BNB's 5.6% correction demonstrated greater relative resilience during that period. However, every cryptocurrency in the comparison still experienced a price decline.
BNB's utility within its blockchain ecosystem and its token-burning mechanism are relevant fundamentals to evaluate. Even so, neither is sufficient to establish the main reason for the difference in market performance.
For investors, price resilience is useful information, but it does not guarantee safety or profits. Market conditions, network activity, and the risks associated with each asset should still be considered before making decisions.

Bittime is a licensed Digital Financial Asset Trader (PAKD) regulated and supervised by Indonesia's Financial Services Authority (OJK) — where you can buy Bitcoin in Indonesia and hundreds of other crypto assets starting from IDR 10,000. Registration is fast and secure, and you can get started today.
Monitor USDT to IDR conversions and real-time price movements of your favorite crypto assets. Everything is available in a single crypto investment app that you can download for free from the Play Store.
Ready to get started? Sign up for Bittime now and put your investment strategy into action on a platform already trusted by millions of users in Indonesia.
FAQ
Why did the crypto market weaken in November 2026?
The cryptocurrency market faced pressure from economic uncertainty, changes in investor sentiment, and industry developments affecting market confidence. According to Bittime Research, all five major cryptocurrencies analyzed underwent corrections during October 9–November 7, 2026.
Why was BNB more resilient than BTC and ETH?
During the research period, BNB fell by 5.6%, less than BTC's 7.3% and ETH's 9.7%. This demonstrated BNB's relative strength, although the evidence was insufficient to identify the main reason for the performance difference.
Is BNB more stable than Solana and XRP?
During the period examined by Bittime Research, BNB experienced a smaller correction than SOL and XRP. However, this does not mean BNB is always more stable, as each cryptocurrency's volatility can change with market sentiment and trading activity.
Could BNB's price fall if Bitcoin weakens again?
Yes. BNB could still decline when Bitcoin and the broader cryptocurrency market are under pressure. Greater historical resilience does not guarantee that BNB will always experience smaller corrections in future periods.
What is the BNB price outlook after the crypto market correction?
BNB's outlook depends on market conditions, investor demand, and developments within its ecosystem. The prospects of recovery would be more convincing if price gains were supported by trading activity, but there is no guarantee that an uptrend would continue.
Disclaimer: The views expressed belong exclusively to the author and do not reflect the views of this platform. This platform and its affiliates disclaim any responsibility for the accuracy or suitability of the information provided. It is for informational purposes only and not intended as financial or investment advice.

.png)