BTC's resistance level is at $80,000, exceeding this level will trigger extreme volatility
2026-04-27
Bittime - Resistance level Bitcoin at $80,000 is now a critical point that will determine the direction of the market in May 2026.
According to on-chain analyst Murphy, based on options data that includes Gamma exposure, open interest (OI) Based on the strike prices and implied volatility (IV), the $80,000 level is the first significant resistance for BTC and is also an important juncture for the market movement next month.
What happens if BTC breaks through this level? Analysts warn that extreme volatility could soon follow.
Key Takeaways
Bitcoin's resistance level at $80,000 is reinforced by 7,200 BTC open interest with positive Gamma and low implied volatility.
If BTC manages to break through $80,000 and approaches $82,000, the market will enter a zone of extreme volatility due to the negative Gamma position of 4,644 BTC.
Key support levels are at $76,000 and $74,300. A daily close above $80,000 opens the $87,000 target, while a loss of $74,300 risks a drop to $71,900.
Register at Bittime now and start trading crypto with a fast, safe, and easy process in the app.

Why is $80,000 a Strong Wall?
Why is BTC's $80,000 resistance level so strong? According to Murphy's analysis, this level possesses unique and rare characteristics: a combination of high call option open interest, positive Gamma, and low implied volatility (IV).
In simple terms, when the price rises near $80,000, the market maker who sold the call option must hedge by buying Bitcoin.
However, because Gamma is positive and IV is low, the sensitivity of this hedge is very high. As a result, their buying actions can actually create concentrated selling pressure.
This is the trap that makes $80,000 so difficult to break through.
Data shows that at the $80,000 level, there is open interest of 7,200 BTC with significantly positive Gamma.
It is the size of this position that makes this wall of resistance so thick.
Murphy called it a “tough nut to crack” for market movements in May.
Read also:Crypto Market Recap for the Last Week, Updated April 25, 2026!
Bitcoin Volatility Poised to Explode if $82,000 Breaks
Bitcoin's volatility won't immediately explode once $80,000 is surpassed. Analysts warn that the $82,000 area is a more dangerous zone.
If BTC manages to break through $80,000 and move closer to $82,000, the market landscape will change drastically.
At this level, there is a significant negative Gamma position, with open interest reaching 4,644 BTC.
In a negative Gamma scenario, market makers who previously bought when prices rose will reverse course and sell to protect their positions.
This triggered sell-off could shift the market from a state of restraint to a phase of massively increased volatility.
This means that price movements can be very fast and wild in both directions.
Read also:Metaplanet Issues $50 Million in Bonds to Buy Bitcoin (BTC)
Bitcoin Price Analysis: Strong Support Below $80,000
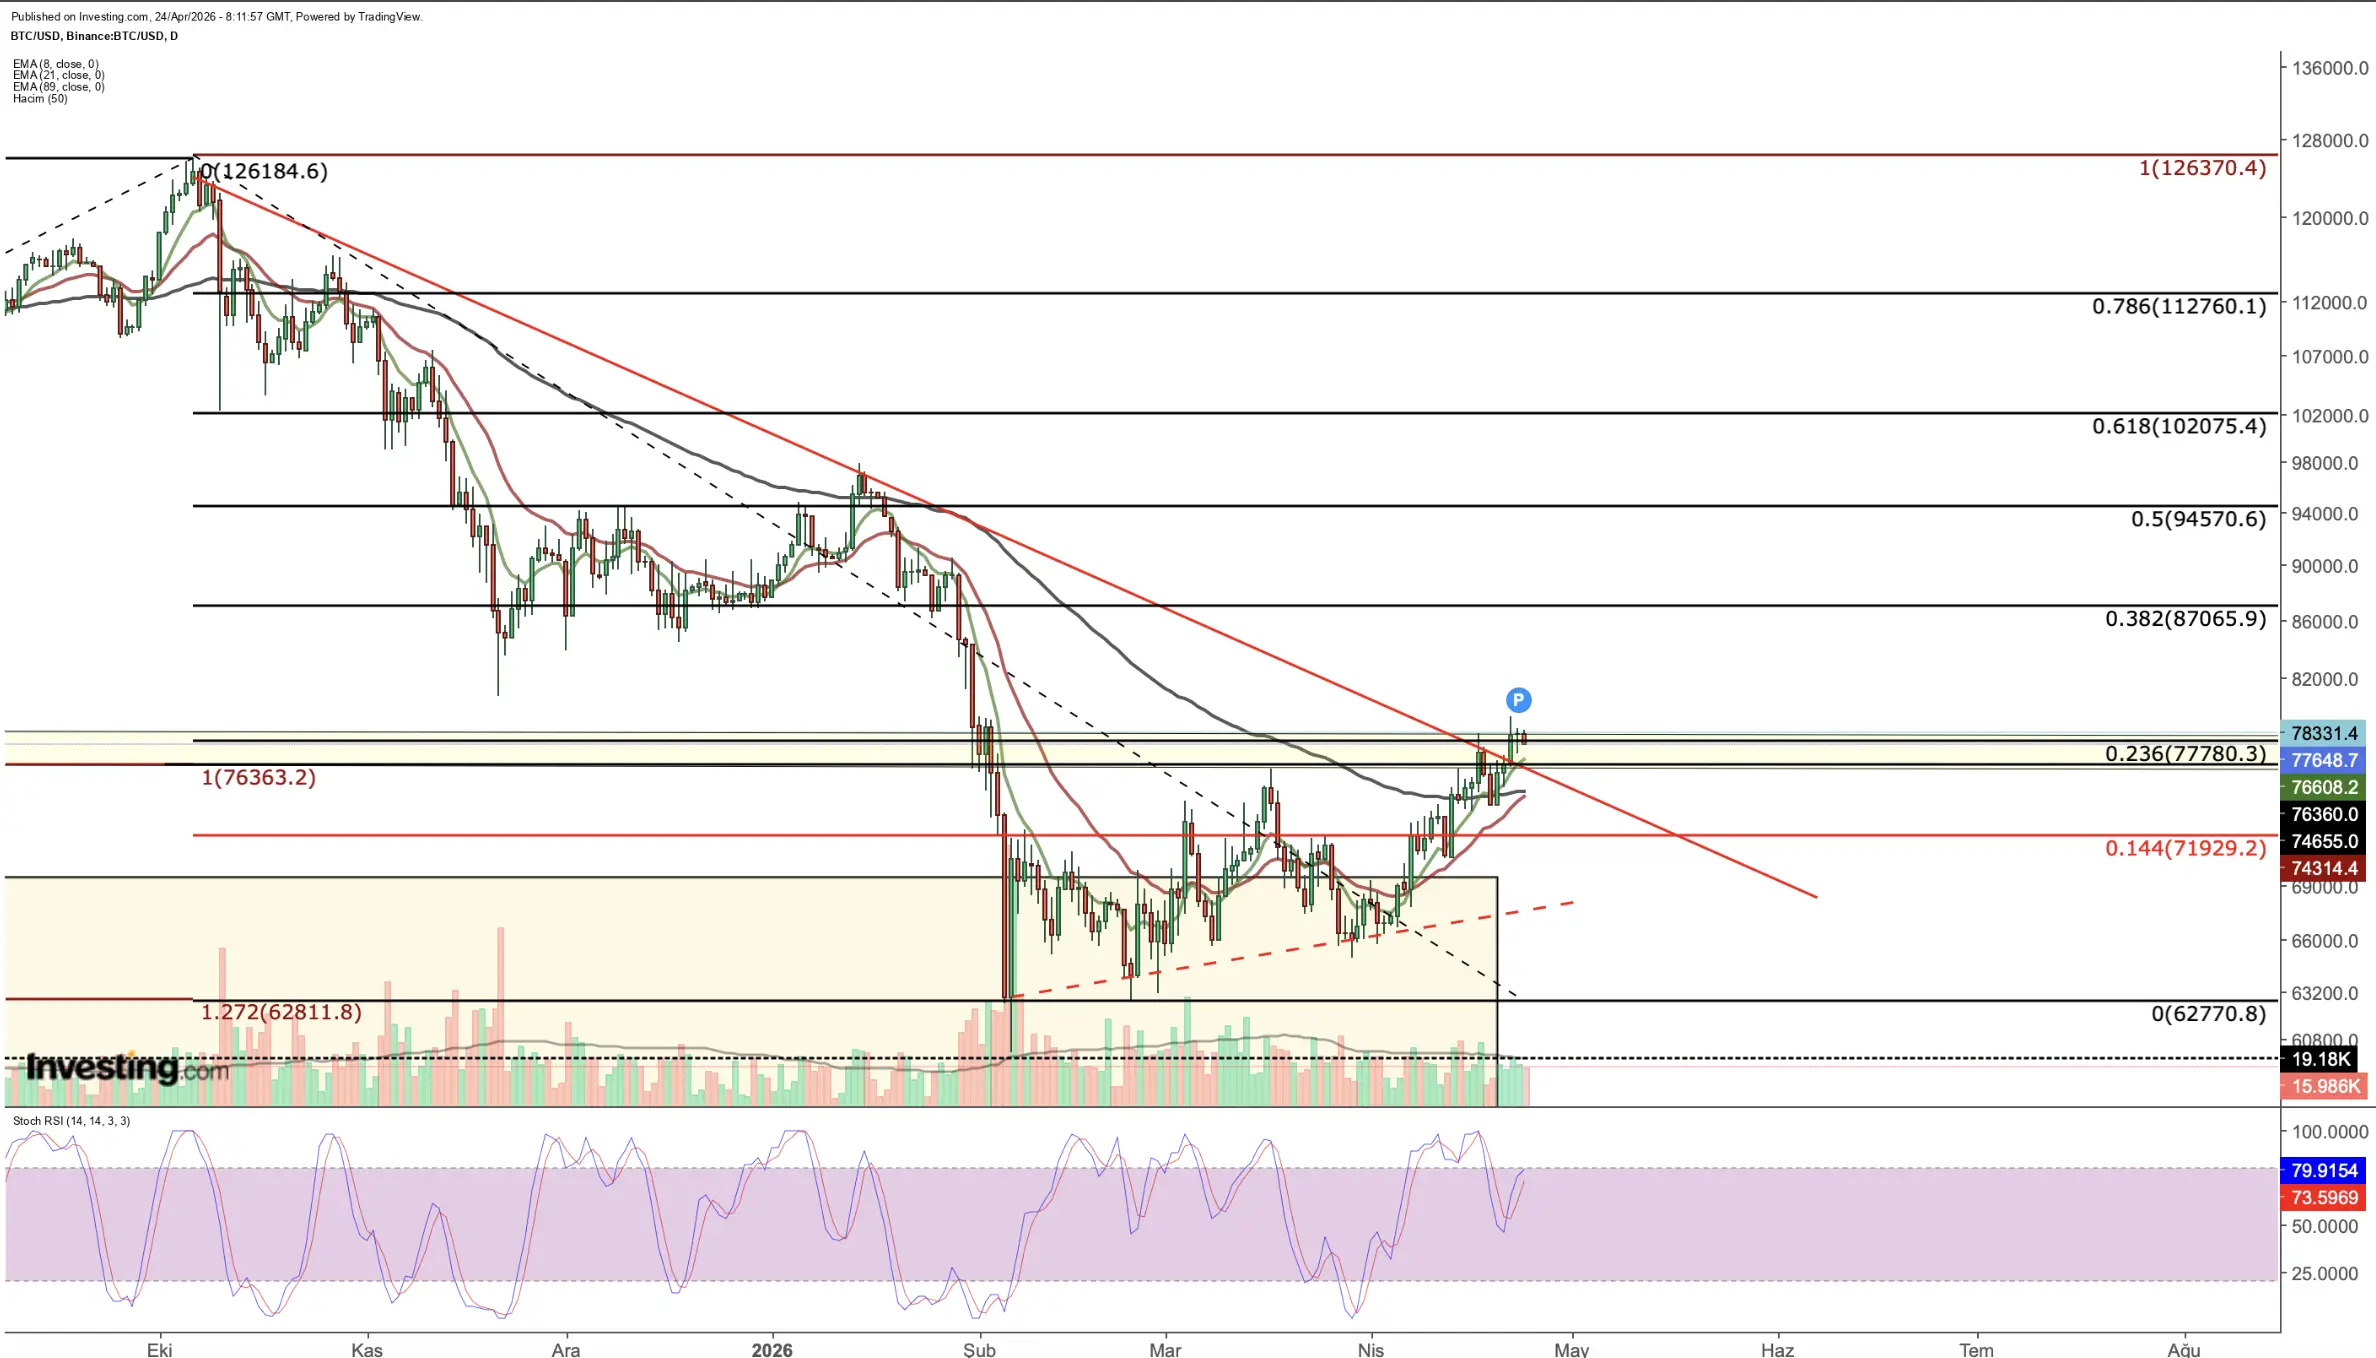
Current Bitcoin price analysis shows that the cryptocurrency has been steadily rising since early April. From a low of around $62,770, BTC is now hovering in the $78,000 to $79,000 range.
Both on-chain and fundamentally, the support is strong. Inflows into US Bitcoin ETFs reached approximately $1 billion in the third week of April.
Bitcoin reserves on exchanges also fell to their lowest level in a year, signaling a glut in supply.
Meanwhile, accumulation by large holders (whales) continues, especially when prices correct.
The nearest technical support is located in the $76,000 area. As long as the price remains above this level, recovery potential remains.
However, if BTC falls below $74,300, the bullish structure could weaken, and the next target is $71,900, with the risk of a decline towards $68,000.
Psychological and Technical Levels Converge
Bitcoin technical analysis confirms that $80,000 is a major milestone. Psychologically, it's a round number that the entire market is watching.
Technically, this level coincides with a long-term downtrend line that has been holding back price action for months.
The combination of these two factors makes $80,000 a “make or break” area.
A daily close above this level would be a very bullish confirmation of the breakout.
The next realistic targets are the $87,000 area, then $94,570, and then $102,000.
Conversely, failure to break through $80,000 in the near term could cause the market to be trapped in a consolidation or short-term correction phase.
Read also:12 Ways to Get Free and Legal Crypto Assets (As of April 2026)
Macro Risks Still Loom
Despite the bullish crypto market structure, investors cannot ignore external pressures. As it relates to Bitcoin price analysis, macroeconomic factors remain a driver of short-term volatility.
Rising crude oil prices due to geopolitical tensions in the Middle East have pushed inflation expectations higher.
This makes it difficult for central banks, especially the Fed, to lower interest rates.
Tighter monetary policy from the Bank of Japan could also trigger a carry trade reversal that could potentially bring down riskier assets, including Bitcoin.
Conclusion: Crucial Decision Point
Bitcoin is currently on the verge of a crucial decision. BTC's resistance level is a thick wall at $80,000, supported by complex options market mechanisms.
The combination of high open interest and positive Gamma at this level, along with low IV, creates subtle but strong selling pressure.
If BTC manages to break through this barrier and reach $82,000, volatility will undoubtedly surge due to the larger negative Gamma position. The market will shift from consolidation to volatile volatility.
Source: Investing.com
Core Analysis:
Current Price: Ranges from $78,000 - $79,000.
Key Resistance: $80,000 (hard to break due to pressure from options).
Volatility Zone: $82,000 and above (potential for rapid wild movement).
Support: $76,000 and $74,300.
Bullish Scenario: A daily close above $80,000 opens the way towards $87,000.
Bearish Scenario: Losing $74,300 risks going to $71,900 or lower.
For traders, the $80,000 level is a key milestone that will determine the market's direction in the coming weeks.
Beyond this point is not just about price increases, but about entering a completely new phase of volatility.
How to Buy Crypto on Bittime?

Want to trade sell buy Bitcoins and crypto investment easily? Bittime is here to help! As an Indonesian crypto exchange officially registered with OJK, Bittime ensures every transaction is safe and fast.
Start with registration and identity verification, then make a minimum deposit of IDR 10,000. After that, you can immediately buy your favorite digital assets!
Check the exchange rate BTC to IDR, ETH to IDR, SOL to IDR and other crypto assets to find out today's crypto market trends in real-time on Bittime.
Also, visit the Bittime Blog for interesting updates and educational information about the crypto world. Find reliable articles about Web3, blockchain technology, and digital asset investment tips designed to enrich your crypto knowledge.
FAQ
Why is the $80,000 level such a strong resistance?
Because at this level, there's a large accumulation of open interest in call options with positive Gamma, while implied volatility is low, this situation makes hedging by market makers highly sensitive and actually creates concentrated selling pressure.
What is the volatility zone at $82,000?
At $82,000, there's a significant negative Gamma position. When the price touches this zone, market makers will reverse course and sell, which can trigger a surge in volatility and rapid, wild price movements.
What is the Bitcoin price target if it breaks through $80,000?
If Bitcoin manages to record a daily close above $80,000, the next target will be the psychological level of $87,000. After that, the next targets are $94,570 and $102,000.
Where is the nearest support level to guard?
The nearest support is located at $76,000. If this level is broken, the next significant support areas are $74,300 and $71,900.
Besides technical factors, what influences BTC's current movement?
Inflows of funds into Bitcoin ETFs, accumulation by whales, and macroeconomic pressures such as the Fed's interest rate policy, crude oil prices, and Bank of Japan policy also significantly influence the current BTC price movement.
Disclaimer: The views expressed belong exclusively to the author and do not reflect the views of this platform. This platform and its affiliates disclaim any responsibility for the accuracy or suitability of the information provided. It is for informational purposes only and not intended as financial or investment advice.

.png)