Shiba Inu Soars After Listing on Solana, Can SHIB Reach $0.000006?
2026-10-05
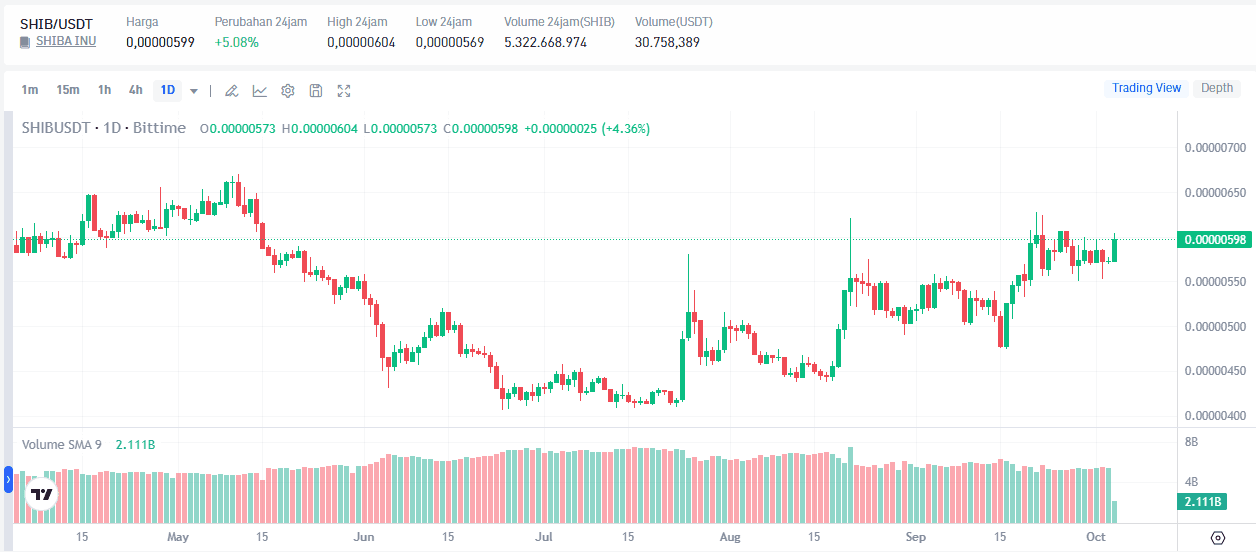
Shiba Inu Price is back in the spotlight after SHIB gained trading access through the Solana ecosystem. As of October 5, 2026, SHIB is trading at around US$0.00000596, up approximately 3.9% over 24 hours, putting it less than 1% away from US$0.000006.
The biggest question now is not only why Shiba Inu is rising, but whether the momentum is strong enough to push SHIB above the US$0.000006 resistance. The Solana listing expands trading access, but a breakout still requires stronger volume and demand.
Key Takeaways
- SHIB is trading around US$0.00000596 and is approaching the US$0.000006 resistance again.
- The Solana listing expands SHIB's access to markets and applications in the Solana ecosystem, but does not guarantee a price increase.
- A breakout above US$0.000006 with strong volume is key if SHIB is to continue rising toward the US$0.0000062–US$0.0000067 range.
Shiba Inu Price Hari Ini dan Pergerakan SHIB
Shiba Inu Price berada di sekitar US$0.00000596 berdasarkan data terbaru yang tersedia pada 5 Oktober 2026. Dalam 24 jam, SHIB tercatat menguat sekitar 3.9%, sementara dalam 30 hari pergerakannya sudah menunjukkan pemulihan yang lebih besar.
Historical data shows that SHIB closed at around US$0.00000575 on October 3, with trading volume of approximately US$41.18 million and a market capitalization of around US$3.38 billion. Subsequent data shows SHIB's market capitalization was approximately US$3.39 billion on October 4.
These conditions indicate that SHIB is in a recovery phase, but there is not yet enough evidence to confirm a bullish trend. The resistance around US$0.000006 remains the main hurdle.
Read also: Baby Doge Coin vs. Shiba Inu: Which Meme Coin Is More Appealing in 2026?
Why Is Shiba Inu Rising After Its Solana Listing?
One important development is SHIB's entry into the Solana ecosystem through Sunrise, infrastructure that allows assets from other ecosystems to have a canonical representation on Solana.
This means SHIB is not leaving Ethereum or Shibarium. The token retains its original ERC-20 form, while the Solana integration gives users a new way to trade SHIB through applications and markets on that network.
1. SHIB Gains Broader Market Access
The Solana listing makes SHIB more accessible to users already active in that ecosystem. An asset that previously existed in the Ethereum ecosystem now has a representation that can be used in the Solana environment.
However, greater access does not automatically mean greater demand. More trading venues also give SHIB holders additional places to sell their assets.
2. Solana Has an Active Trading Ecosystem
Solana has high activity in the DeFi sector and digital-asset trading. As a result, SHIB's presence on the network may broaden the token's exposure to users who previously did not trade it on Ethereum.
The potential benefit will be more significant if trading activity persists after the news-driven effect fades.
3. Meme Coin Sentiment Still Matters
SHIB remains highly influenced by market sentiment. Its price action is driven not only by network fundamentals, but also by meme coin momentum, the condition of Bitcoin, market liquidity, and trader activity.
Recent data also shows SHIB's rise moving in line with a broader crypto market recovery. Therefore, SHIB's gains should not be attributed solely to the Solana listing.
Read also: Shiba Inu Inflows Top 2.4 Trillion Tokens: What Is Driving This Major Surge?
SHIB Price Analysis: Will Bullish Momentum Continue?
From a technical perspective, SHIB's current structure is interesting because the price has recovered from below US$0.000005 and is approaching US$0.000006 again.
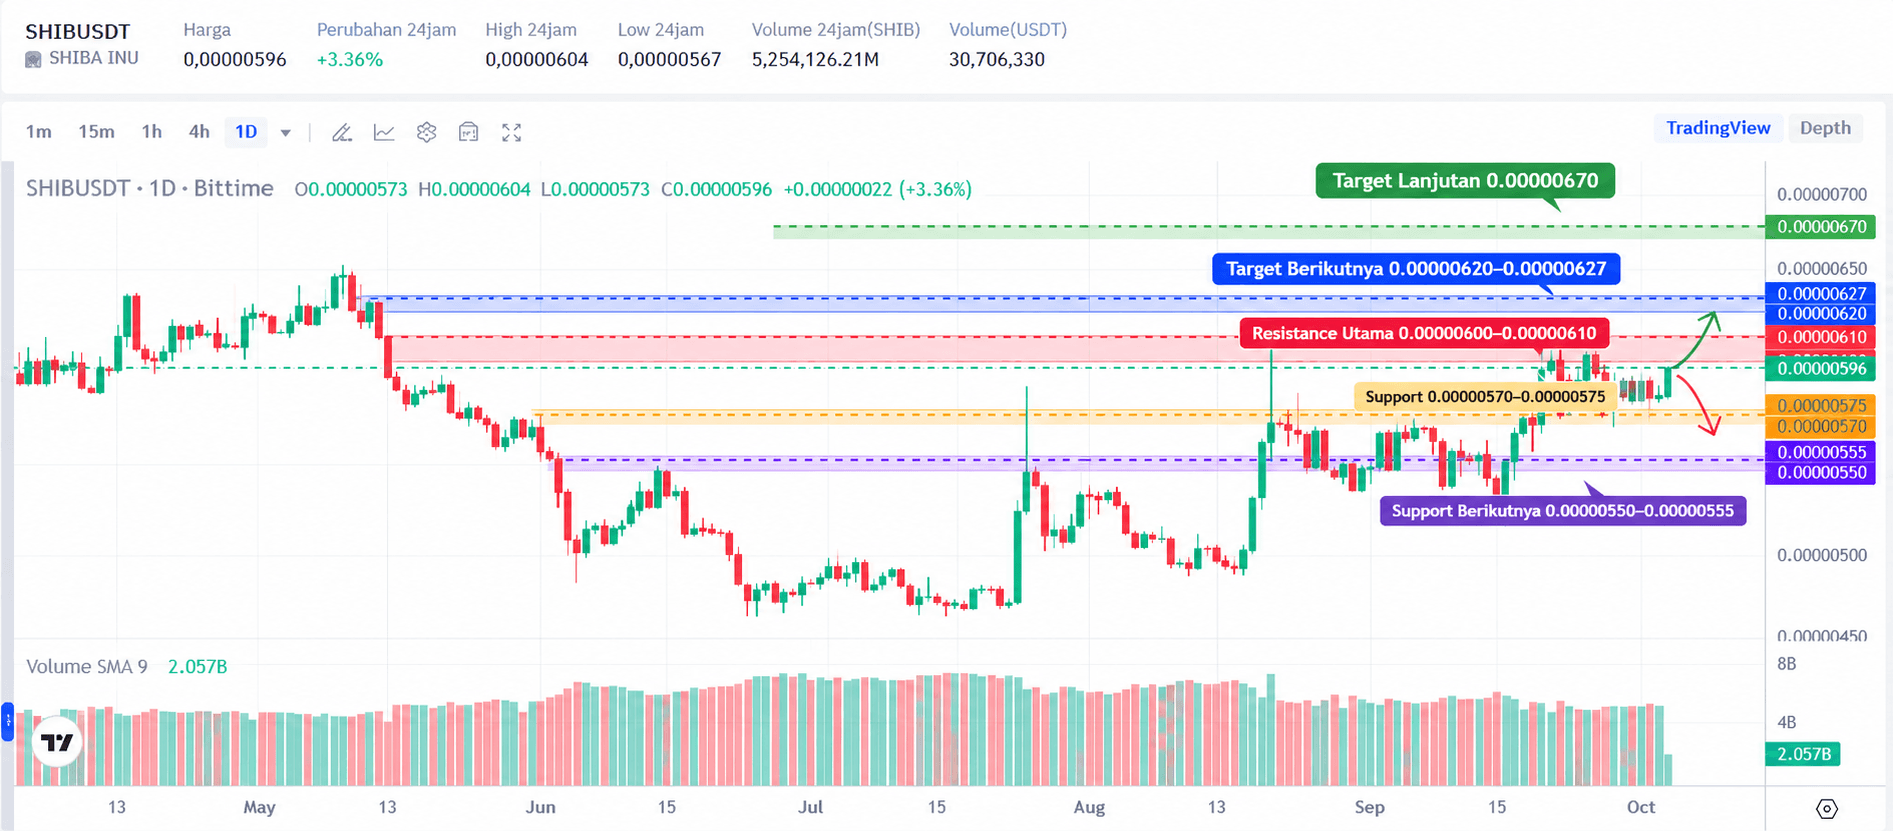
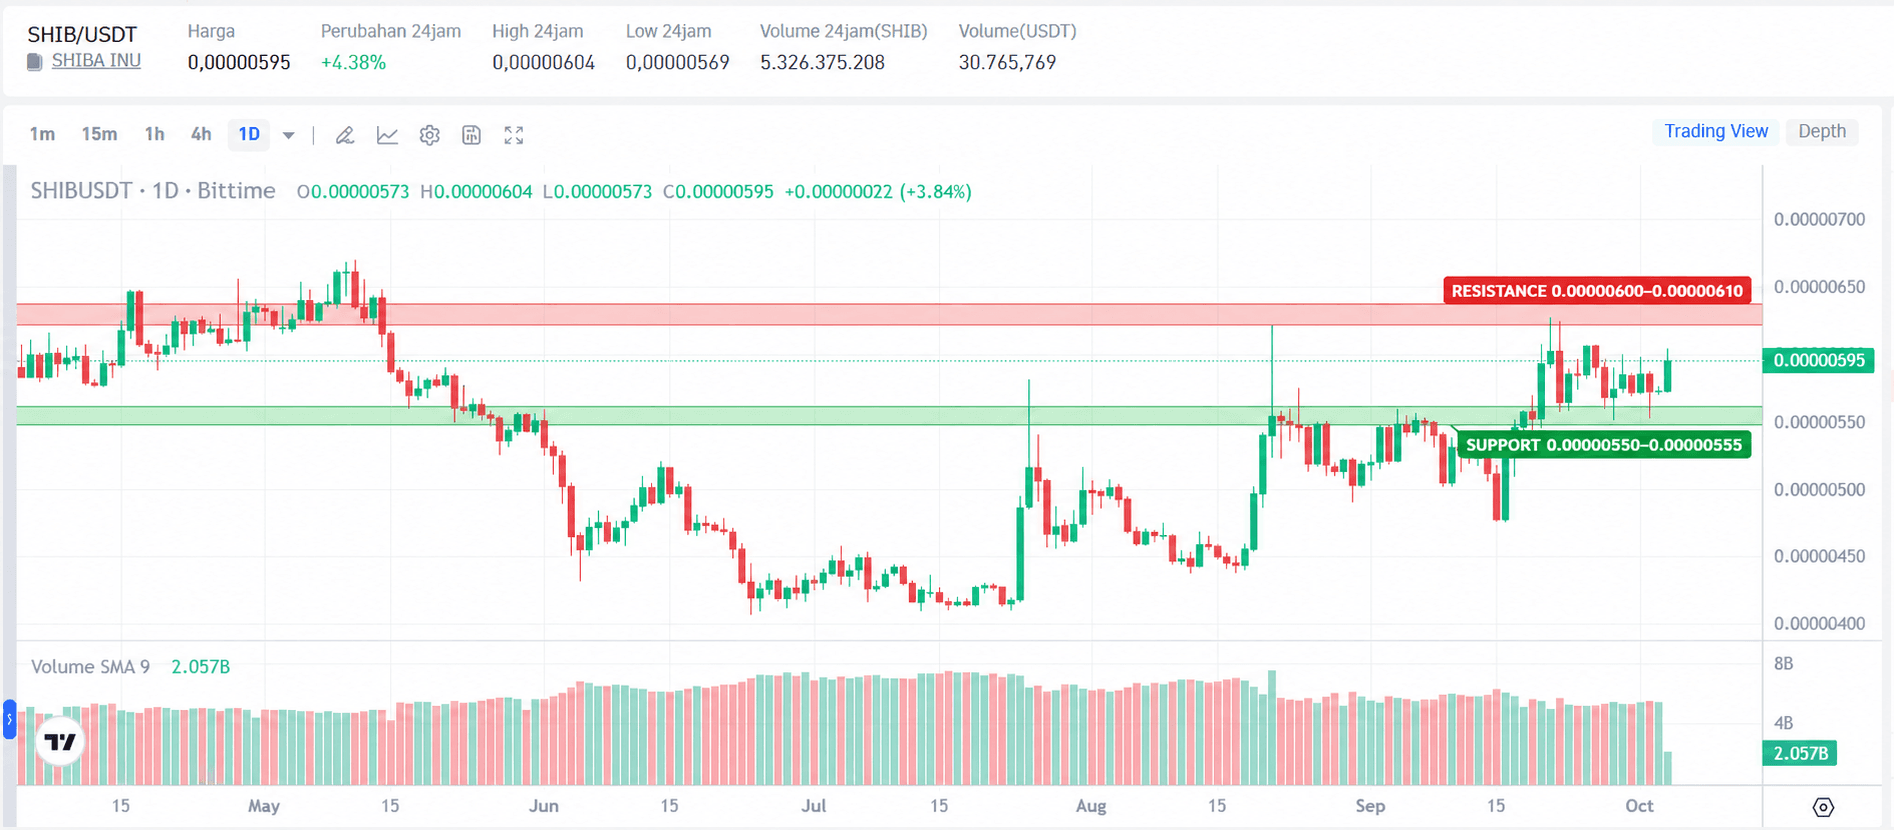
Recent analysis places US$0.000006–US$0.0000061 as the main resistance. This area has rejected price several times, so a brief breakout is not enough to confirm a trend change.
SHIB is also trading near the upper boundary of its consolidation range. This makes the next few sessions important in determining whether buyers can take control or face renewed selling pressure.
SHIB's Key Resistance Levels
Several levels to watch:
- US$0.00000591–US$0.00000600: nearest resistance.
- US$0.00000600–US$0.00000610: main breakout zone.
- US$0.00000620–US$0.00000627: next resistance if the breakout succeeds.
- Around US$0.00000670: further target in a bullish scenario.
The US$0.000006–US$0.0000061 range is the most important because it is near several previous highs. A break above this area on rising volume would provide stronger confirmation than a mere wick or intraday rise.
SHIB's Key Support Levels
On the downside, several areas to monitor are:
- US$0.00000570–US$0.00000575: short-term support.
- US$0.00000550–US$0.00000555: a more important defense area.
- US$0.00000530–US$0.00000540: the next support zone if the correction continues.
If SHIB experiences only a mild pullback and holds above these support levels, its recovery structure remains relatively intact. Conversely, repeated declines below US$0.00000550 would weaken short-term bullish momentum.
Read also: Top Ethereum Meme Coins in 2026: How to Buy on Bittime
Can SHIB Break Above US$0.000006?
The answer remains uncertain, but US$0.000006 should be treated as resistance, not a target that will be reached automatically.
At around US$0.00000596, SHIB needs to rise only about 0.7% to reach US$0.000006. However, touching that level is different from breaking through it and holding it as support.
This is an important part of interpreting Shiba Inu price predictions. The price may move above US$0.000006 intraday, but if it then falls back below that level, the breakout is not strongly confirmed.
Bullish SHIB Scenario
The bullish scenario becomes more compelling if SHIB can:
- Break above US$0.000006–US$0.0000061.
- Close above that resistance.
- Hold its price above the breakout area.
- Receive support from rising trading volume.
If these conditions occur, US$0.00000620–US$0.00000627 becomes the next resistance. After that, US$0.0000067 may become an area to watch if momentum continues to strengthen.
In other words, US$0.000006 is not the end of the bullish scenario, but rather the first confirmation level. If it turns into support, the price structure will look more constructive.
Bearish SHIB Scenario
Risk emerges if SHIB is rejected again at US$0.000006 and declines toward support.
The US$0.00000570–US$0.00000575 range is the first area to watch. If it fails to hold, the price may retest US$0.00000550–US$0.00000555.
A further decline toward US$0.00000530–US$0.00000540 would indicate strengthening selling pressure. This could delay the US$0.000006 target.
Read also: SHIB Price Prediction for 2030: Could 100 Million Shiba Inu Worth $781 Today Become $19,710?
3 Factors That Will Determine SHIB's Next Price Move
1. Trading Volume
A breakout without sufficient volume is more vulnerable to becoming a false breakout. Traders should therefore watch whether trading activity increases as SHIB breaks through resistance.
Recent data shows that SHIB volume declined when the price entered consolidation. This makes a rise in volume during a breakout an important confirmation signal.
2. Crypto Market Sentiment
SHIB is a highly volatile asset. Its price can change rapidly when sentiment shifts in Bitcoin and the altcoin market.
SHIB's rise alongside a broader market recovery should be viewed as part of overall market conditions, rather than solely as a result of Shiba Inu-specific developments.
3. Long-Term Impact of the Solana Listing
The Solana listing provides new access, but its fundamental impact should be assessed through activity after launch.
If volume and liquidity in the Solana ecosystem continue to grow, the integration could become a more meaningful catalyst. If activity is high only when the news breaks and then subsides, its impact on SHIB's price will likely be more limited.
Read also: Shibarium Capai 270 Juta Wallet: Apa Artinya untuk Shiba Inu Price?
What Are the Risks of Buying SHIB Near US$0.000006?
A move toward resistance often attracts traders' attention. However, it also increases the risk of buying when the price is near an area where it could be rejected.
Several risks should be considered:
- False breakout, when SHIB moves above US$0.000006 but fails to hold.
- Profit-taking, especially after the price has rebounded.
- Meme coin volatility, which can cause very rapid price movements.
- Declining volume, which can weaken a breakout.
- A crypto market correction, especially if Bitcoin comes under renewed pressure.
Price levels should be used as tools for understanding market scenarios, not as guarantees of future price direction.
So, How Likely Is SHIB to Reach US$0.000006?
Technically, that target is very close to the current price. With SHIB around US$0.00000596, the distance to US$0.000006 is only about 0.7%.
However, the real challenge is not touching US$0.000006. The main challenge is breaking above and holding the US$0.000006–US$0.0000061 zone.
If the breakout is accompanied by strong volume and the price can turn US$0.000006 into support, the path toward US$0.0000062–US$0.0000067 becomes more open. Conversely, repeated rejection could send SHIB back to test support at US$0.0000057 and US$0.0000055.
If you want to follow the latest updates on Shiba Inu, Solana, and other crypto assets, you can register with Bittime to receive regular market information and analysis.
Conclusion
Shiba Inu Price kembali mendekati level penting setelah SHIB mendapatkan akses perdagangan melalui Solana. Integrasi tersebut memperluas akses SHIB ke ekosistem baru, tetapi belum cukup untuk memastikan kenaikan berkelanjutan.
Technically, US$0.000006–US$0.0000061 is the key zone. A breakout on strong volume could open the way toward US$0.0000062–US$0.0000067, while rejection could lead SHIB to retest support around US$0.0000055.
So, can SHIB break above US$0.000006? In terms of price distance, the target is already very close. Confirmation still depends on buyers' ability to hold the breakout, trading volume, and overall crypto market conditions.

Bittime is a licensed Digital Financial Asset Trader (PAKD) platform supervised by the Financial Services Authority (OJK) — where you can buy Bitcoin in Indonesia and hundreds of other crypto assets starting from IDR 10,000. Registration is fast and secure, and you can get started today.
Track the USDT to IDR conversion and your favorite crypto assets' prices in real time. Everything is available in one crypto investment app that can be downloaded for free from the Play Store.
Ready to get started? Sign up on Bittime now and put your investment strategy into action with a platform trusted by millions of users in Indonesia.
FAQ
What is Shiba Inu's price today?
Shiba Inu Price berada di sekitar US$0.00000596 berdasarkan data terbaru yang tersedia pada 5 Oktober 2026. Pergerakan intraday dapat berbeda antar platform karena likuiditas dan waktu pembaruan data.
Why is Shiba Inu rising after its Solana listing?
The Solana listing expands SHIB's access to users and markets in the Solana ecosystem. However, the price increase cannot automatically be attributed solely to the listing, since SHIB is also affected by overall crypto market conditions and trading activity.
Can Shiba Inu reach US$0.000006?
SHIB is only about 0.7% away from US$0.000006, based on a price of around US$0.00000596. More importantly, can SHIB break through the US$0.000006–US$0.0000061 zone and hold it as support?
What are SHIB's key resistance levels?
The main resistance is around US$0.000006–US$0.0000061. If this area is broken with volume support, attention may shift next to around US$0.0000062–US$0.00000627.
Is SHIB still bullish?
Short-term momentum still reflects a recovery, as SHIB has moved back toward US$0.000006. However, the bullish bias would be stronger if the price breaks out and holds above US$0.000006–US$0.0000061, rather than merely touching that level.
Disclaimer: The views expressed belong exclusively to the author and do not reflect the views of this platform. This platform and its affiliates disclaim any responsibility for the accuracy or suitability of the information provided. It is for informational purposes only and not intended as financial or investment advice.

.png)