Crypto Fear and Greed Index Enters Fear Zone, What Happened
2026-11-13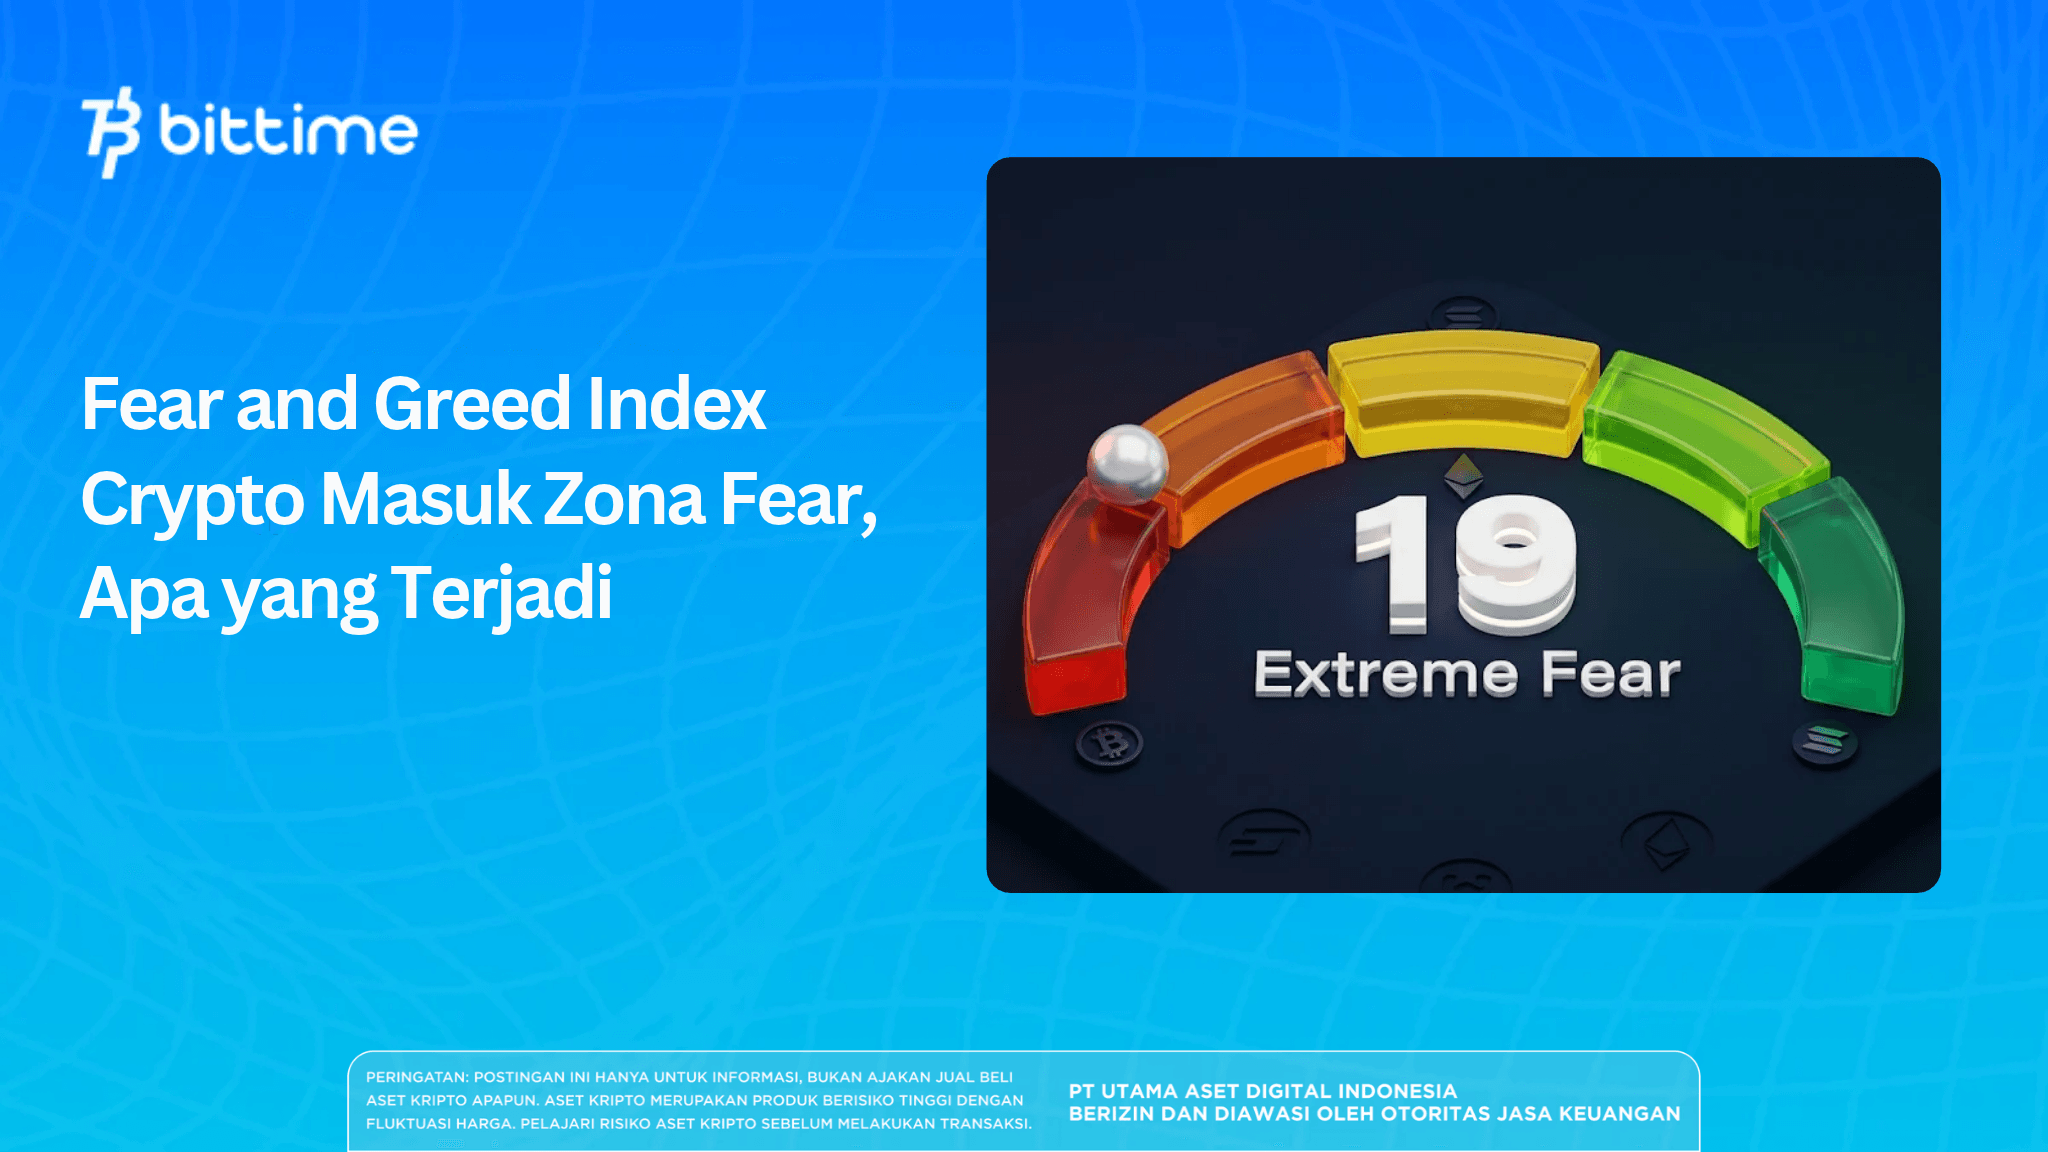
The number 19 appeared on CoinMarketCap's screen on Friday, November 13, 2026, and left many traders silent. Crypto fear and greed index slid to a level last seen four months ago, while the price of Bitcoin fell below US$ 70,000. In today's crypto fear and greed reading, the market is no longer merely cautious. It has entered extreme fear.
Key Takeaways
- The CMC index is at 19 (Extreme Fear), down from 22 yesterday, 31 a week ago, and 55 (Neutral) a month ago.
- Bitcoin broke below US$ 70,000 and leveraged position liquidations exceeded US$ 1 billion.
- The triggers are layered: ETF outflows, expectations of a Fed rate hike, and thin liquidity. This index is not an automatic buy or sell signal.
What Does a Crypto Fear and Greed Index Reading of 19 Mean?
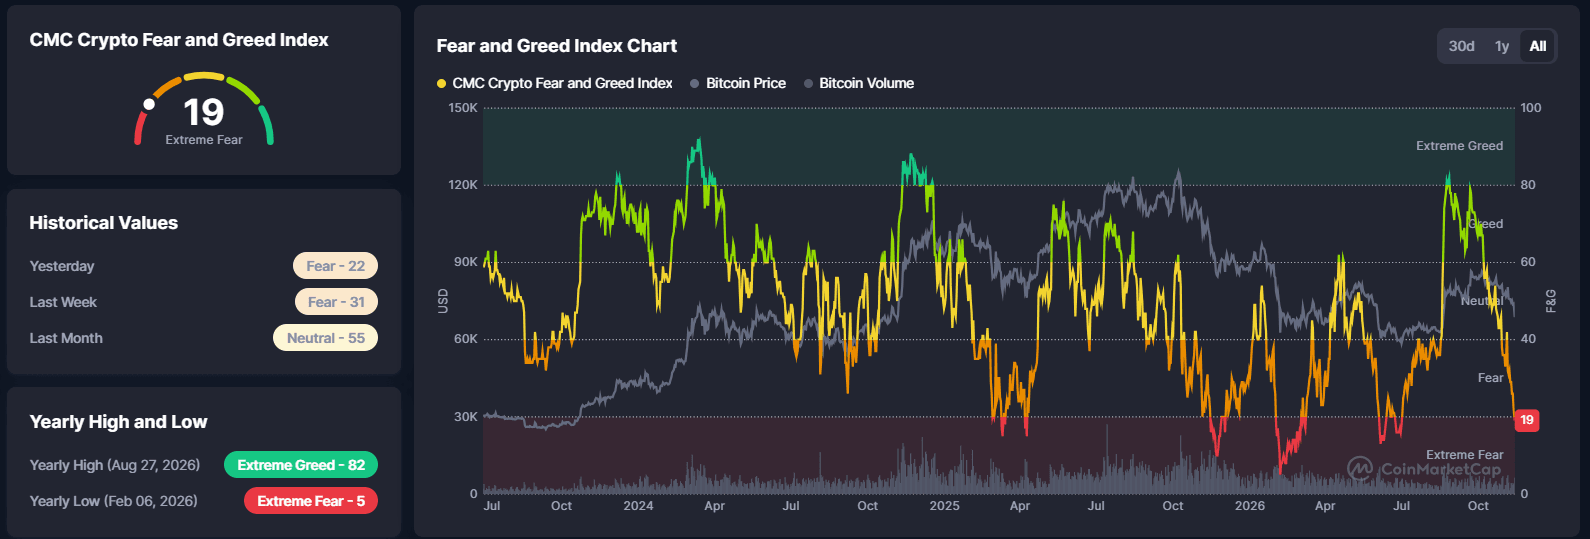
Data CoinMarketCap shows the index at 19 with an Extreme Fear label. Yesterday it was 22, still in Fear. A week ago it was 31, and a month ago it was 55 in the Neutral zone.
This year's peak was 82 (Extreme Greed) on August 27, 2026, while its lowest point was 5 on February 6, 2026. So the index plunged from 82 to 19 in less than three months.
For those looking for another version of today's fear and greed index, the number is slightly different. Alternative.me recorded the index falling to 20 from 28 the previous day, according to TechFlow. According to Cointelegraph, that is the lowest reading in more than four months, and a similar level was last seen on July 8.
The difference in numbers is reasonable, because each provider uses its own formula. CMC calculates it from five components: price momentum, volatility, derivatives market, market composition, and internal data such as search trends and user engagement. The story direction is the same: fear is dominant.
When you type "fear and greed shows fear" into a search engine, the answer has now shifted. From Fear yesterday, the market has entered Extreme Fear today.
Want to monitor crypto asset movements while sentiment is under pressure? You can start by registering on Bittime.
Read Also: Why Did Bitcoin Dump After the US Election? History and Causes
Causes of the Crypto Market Decline
The pressure is most visible in price. According to The Block, Bitcoin plunged 7% in 24 hours to US$ 68,408, the lowest since August. CoinGlass data recorded US$ 1.47 billion in liquidations, and US$ 1.31 billion of that came from long positions. That means traders betting on higher prices were hit the most.
The first factor is institutional fund outflows. Spot Bitcoin ETFs recorded about US$ 300 million in outflows on Wednesday, extending a five-day streak, according to FXStreet citing SoSoValue. Ethereum ETFs were also under pressure with US$ 145 million in outflows.
The second factor is interest rates. Giottus CEO Vikram Subburaj assessed that Bitcoin's weakness was triggered by institutional outflows, tightening liquidity, and expectations of a Fed rate hike in December, according to Cointelegraph.
US inflation data for October was also hotter than expected, so bond yields rose and demand for risk assets weakened, according to Newsy Today.
The third factor is thinning liquidity. Talos noted that Bitcoin's 1% order book depth on Binance, Kraken, and Coinbase fell to US$ 72 million on November 9, about 33% below normal. A thin market makes a single wave of selling easy to amplify. Talos also warned that high leverage can reinforce volatility.
Global sentiment also weighed. The Block said the impact of the departure of Nvidia co-founder Jensen Huang also shook the market.
Meanwhile, FXStreet assessed that interest in crypto assets has faded in recent weeks, influenced by macro uncertainty and risk-off sentiment after the Binance hack with an impact of about US$ 6.3 billion.
Read Also: Crypto Recommendations Worth Watching for November 2026
Does Extreme Fear Mean It's Time to Buy?
Some investors use this index as a contrarian tool, that is, daring to buy when others are afraid. CoinMarketCap itself says a low reading can indicate a buying opportunity, but this index should not be used alone.
Market data has not yet confirmed a price bottom. According to a K33 Research report cited by FXStreet, trading volume is still below the level when the market formed its previous bottom, so buying interest is limited.
As of November 12, Bitcoin also remained below its 50-, 100-, and 200-day exponential moving averages, with RSI at 34.
Therefore, the index is better read as an emotion thermometer, not a price prediction. Some things to watch:
- Limit leverage, because most liquidations occurred in long positions.
- Buy gradually, not all at once, so you don't get stuck with prices that are still falling.
- Monitor ETF flows and inflation data as determinants of the next direction.
For reference on crypto assets you can monitor, visit the Bittime blog. This information is not financial or investment advice.
Conclusion
The crypto fear and greed index at 19 indicates the market is dominated by fear, triggered by ETF outflows, expectations of higher interest rates, and thin liquidity. This number is useful for reading market mood, but it is not enough to declare that a price bottom has formed. Combine it with other data and manage risk with discipline.
Check the price of Bitcoin (BTC), Ethereum (ETH), XRP, Solana (SOL), GRAM, and BNB as well as the leading memecoin DOGE. You can trade directly on Bittime!

Bittime is a licensed Digital Financial Asset Trader (PAKD) platform supervised by the Financial Services Authority — where you can buy Bitcoin in Indonesia and hundreds of other crypto assets starting from Rp10,000. The registration process is fast, secure, and can be started today.
Track the conversion of USDT to IDR and real-time price movements of your favorite crypto assets. Everything is available in one crypto investment app that can be downloaded for free on the Play Store.
Ready to start? Register now on Bittime and execute your investment strategy with a platform trusted by millions of users in Indonesia.
FAQ
1. What is the crypto fear and greed index?
This index measures the mood of the crypto market on a scale from 0 to 100. The lower the number, the greater the fear. The higher it is, the greater the greed.
2. Why are the CMC and Alternative.me numbers different?
Both use their own formulas and data sources. CMC records 19, while Alternative.me records 20, but both are in the Extreme Fear zone.
3. Does extreme fear mean the price has bottomed?
Not necessarily. The index only reflects current sentiment. The market can remain under pressure for a long time, especially if fund outflows continue and buying volume has not returned.
4. Where can I check today's fear and greed index?
You can open the Fear and Greed Index page on CoinMarketCap or the Alternative.me site. CoinMarketCap also provides historical data through a free API.
Disclaimer: The views expressed belong exclusively to the author and do not reflect the views of this platform. This platform and its affiliates disclaim any responsibility for the accuracy or suitability of the information provided. It is for informational purposes only and not intended as financial or investment advice.

.png)