How to Read the MACD Indicator in Crypto Trading for Beginners
2026-01-19
In crypto trading, technical indicators are the primary tool for predicting price direction. One of the most frequently used indicators by traders, both beginners and professionals, is theMACD.
However, many people still use MACD without really understanding how to read it. In this article, we will discuss how to read MACD indicators in crypto trading in a comprehensive, simple, and easy-to-practice manner.
Key Takeaways
- MACD helps to read the momentum and direction of crypto price trends.
- Crossover and divergence signals are the main keys to reading MACD.
- MACD is most effective when combined with other indicators.
What is MACD Indicator in Crypto Trading?
Image Source: Vecteezy
MACD stands for Moving Average Convergence Divergence. This indicator was created by Gerald Appel and is used to measure momentum and price trend direction.
MACD indicator works by comparing two Exponential Moving Average (EMA), which is a short-period EMA and a long-period EMA. Because it's momentum-based, the MACD is well-suited to volatile and frequently changing crypto markets.
Traders usually use MACD to:
- Looking for buy and sell signals.
- Knowing whether the trend is strong or weak.
- Detecting potential price reversals.
Read Also: Manta Network (MANTA) Price Prediction 2026: Latest Analysis
Main Components of the MACD Indicator
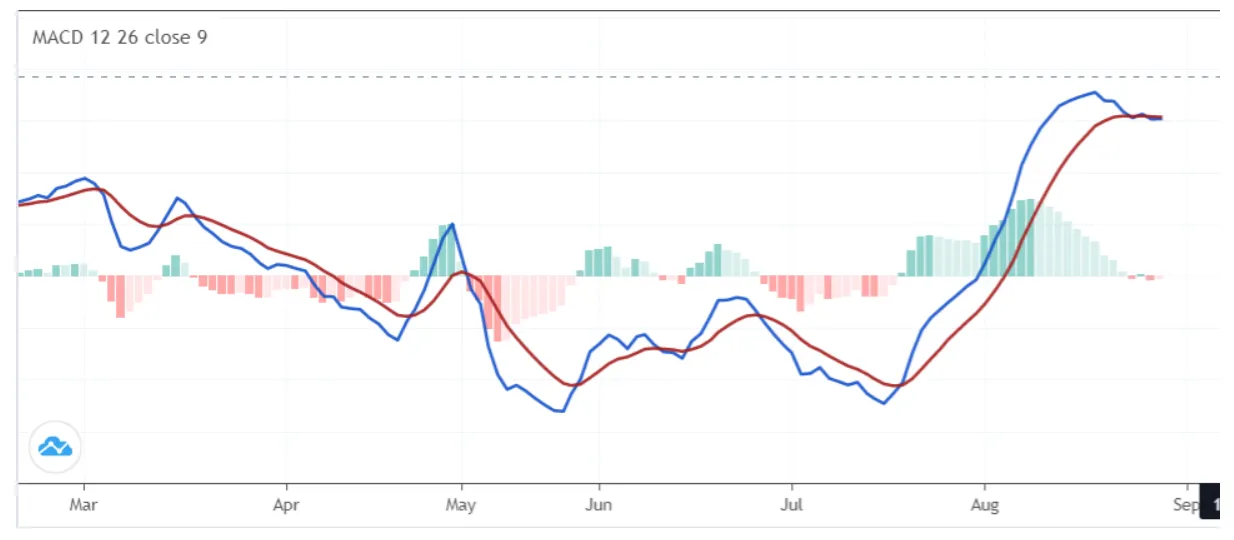
Image Source: Stockbit
Before getting into how to read the MACD indicator, you must first understand its three main components.
1. MACD Line
The MACD line is the main line (usually blue) which is calculated from the difference of EMA 12 and EMA 26.
If the MACD line rises → bullish momentum
If the MACD line goes down → bearish momentum
2. Signal Line
The signal line is usually red or orange. This line is EMA 9 of MACD line, and serves as a trigger for buy or sell signals.
3. Histogram
The histogram is in the form of green and red bars around the zero line. The histogram shows distance between MACD line and signal line.
The longer the histogram → the stronger the momentum
Histogram is getting shorter → momentum is weakening
Read Also: RAI Token (RAI) Price Prediction 2026: Latest Chart Analysis
How to Read the MACD Indicator
Now, here's how to read MACD indicators in crypto trading:
1. Reading Crossover Signals
Crossover is the most basic and most frequently used signal.
Bullish Crossover: It happened when MACD line cuts signal line from bottom to top. This indicates that momentum is starting to strengthen upwards and is often considered a buy signal.
Bearish Crossover: Occurs when the MACD line crosses the signal line from top to bottom. It is usually considered a sell signal because momentum is starting to weaken.
To make the signal more valid, also pay attention to the histogram:
The green histogram is getting bigger → the bullish signal is getting stronger
The red histogram is getting bigger → selling pressure is getting more dominant

2. Reading Histograms and Zero Lines
The zero line is an important boundary in MACD.
MACD above zero→ bullish trend
MACD below zero→ the trend tends to be bearish
If the MACD breaks through the zero line from below to above, it could signal the start of a new uptrend. Conversely, if it breaks through the zero line, there's potential for the downtrend to continue.
3. Reading Divergence (The Most Accurate Signal)
Divergence is a condition where the price direction and MACD are not in line. This is often an early signal of a trend reversal.
Bullish Divergence:
- Price makes a lower low
- MACD actually makes a higher low
This means that selling pressure is starting to weaken and there is potential for prices to reverse upwards.
Bearish Divergence
- Price makes higher high
- MACD makes a lower high
This indicates that buying momentum is weakening and prices have the potential to fall.
Read Also: Dolomite (DOLO) Price Prediction: Trend & Sentiment Analysis
Practical Ways to Use MACD on Crypto Charts
For daily use, you can follow these simple steps:
1. Recommended Settings
- Use default parameter 12, 26, 9
- Timeframe ideal: 4H or 1D
- Avoid 1H if you are inexperienced because it is too noisy.
2. Additional Confirmation
MACD should not be used alone. Combine it with:
- RSI (above 50 for bullish)
- Support & resistance
- Volume (volume up = more valid signal)
Read Also: Polyhedra Network (ZKJ) Price Prediction: Short to Long Term
Conclusion
Reading MACD indicators in crypto trading is actually not as complicated as you might think. The key lies in understanding crossovers, histograms, zero lines, and divergences.
The MACD indicator is very useful for reading momentum and trends, but it still has weaknesses when used alone.
Use the MACD as a confirmation tool, not the sole reference. With practice and a combination of other indicators, the MACD can be a very powerful tool in crypto trading.
Read Also: Pirate Nation (PIRATE) Price Prediction: Short, Medium, and Long Term Outlook
How to Buy Crypto on Bittime
Want to trade sell and buy Bitcoins and easy crypto investing? Bittime is here to help! As an Indonesian crypto exchange officially registered with Bappebti, Bittime ensures every transaction is secure and fast.
Start by registering and verifying your identity, then make a minimum deposit of IDR 10,000. After that, you can immediately purchase your favorite digital assets!
Check the course BTC to IDR, ETH to IDR, SOL to IDR and other crypto assets to find out today's crypto market trends in real-time on Bittime.
Additionally, visit Bittime Blog to get various interesting updates and educational information about the world of crypto. Find trusted articles on Web3, blockchain technology, and digital asset investment tips designed to enrich your crypto knowledge.
FAQ
Is MACD suitable for beginners?
Yes, MACD is quite beginner-friendly because the visuals are clear and the signals are easy to recognize.
Best timeframe for MACD in crypto?
The 4-hour and 1-day timeframes are most ideal because they are more stable and have minimal noise.
Is MACD always accurate?
No. The MACD can give false signals, especially in sideways markets. Therefore, confirmation with other indicators is necessary.
What is the difference between MACD and RSI?
MACD focuses on momentum and trends, while RSI focuses more on overbought and oversold conditions.
Can MACD be used for scalping?
Yes, but the risks are higher. For scalping, MACD is best combined with fast indicators and strict risk management.
Disclaimer: The views expressed belong exclusively to the author and do not reflect the views of this platform. This platform and its affiliates disclaim any responsibility for the accuracy or suitability of the information provided. It is for informational purposes only and not intended as financial or investment advice.

.png)