How to Read Candlestick Trading Correctly and Easily
2026-05-29
Have you ever been confused by a trading chart full of green and red candlesticks? Don't worry.
The correct way to read candlestick trading is actually quite easy to understand, especially for beginners like you who are just learning candlestick trading.
Candlesticks are a simple tool that shows the price movement of an asset, such as stocks or cryptocurrencies, over a period of time. By understanding this, you can determine whether the price is rising or falling, and even predict its likely future direction.
Key Takeaways
- Each candlestick has a body and wick that show four important prices: open, high, low, and close.
- Green means the price is rising (bullish), while red means the price is falling (bearish).
- Candlestick patterns like doji or hammer can signal a reversal, but always confirm it with the overall trend.
Register at Bittime now and start trading crypto with a fast, safe, and easy process in the app.
What Are Candlesticks and How to Read Them
Candlestick trading is a chart that resembles small candles. Each candle represents price movements over a specific period of time, such as 1 hour, 1 day, or 1 week. You can choose a timeframe that suits your strategy. It's important to first understand the basic components to facilitate candlestick reading.
Each candlestick has four main data points, known as OHLC. The open is the price at the start of the period. The high is the highest price reached. The low is the lowest price. The close is the price at the close of the period. These data points form two parts: the body and the wick.
The body is the rectangular section in the center. If the body is green or white, it means the closing price was higher than the opening price.
This indicates strong buying pressure, or bullish. Conversely, a red or black body indicates the closing price was lower than the opening price, resulting in greater selling pressure, or bearish. The longer the body, the stronger the price movement.
Wicks or shadows are thin lines above and below the body. The upper wick indicates the high price, while the lower wick indicates the low price.
A long wick indicates that the price rose or fell significantly but was ultimately rejected. For example, a long lower wick on a green candlestick could indicate that buyers successfully pushed the price up again after a decline.
To learn candlestick trading, start with a simple chart. Open a trading app and select a crypto asset such as Bitcoin, then switch to candlestick view. Look at just one candle at a time. Ask yourself: what color? Is the body long or short? Are there any long wicks? With regular practice, you'll quickly memorize them.
Many beginners like to combine candlestick reading with other indicators like moving averages.
But to begin, simply focus on the body and wick. This will provide a clear picture of market sentiment. Remember, one candlestick isn't enough. Look at several consecutive candlesticks to clearly identify the pattern.
Read also: What Are Crypto Bubbles? Today's Visualization and Their Impact on the Market
Important Candlestick Patterns for Candlestick Trading Beginners
Once you understand the basics, the next step is to identify candlestick patterns. These patterns recur and signal whether a trend will continue or reverse. In volatile crypto markets, these patterns are especially useful. Here are some of the main patterns frequently used by beginner traders.
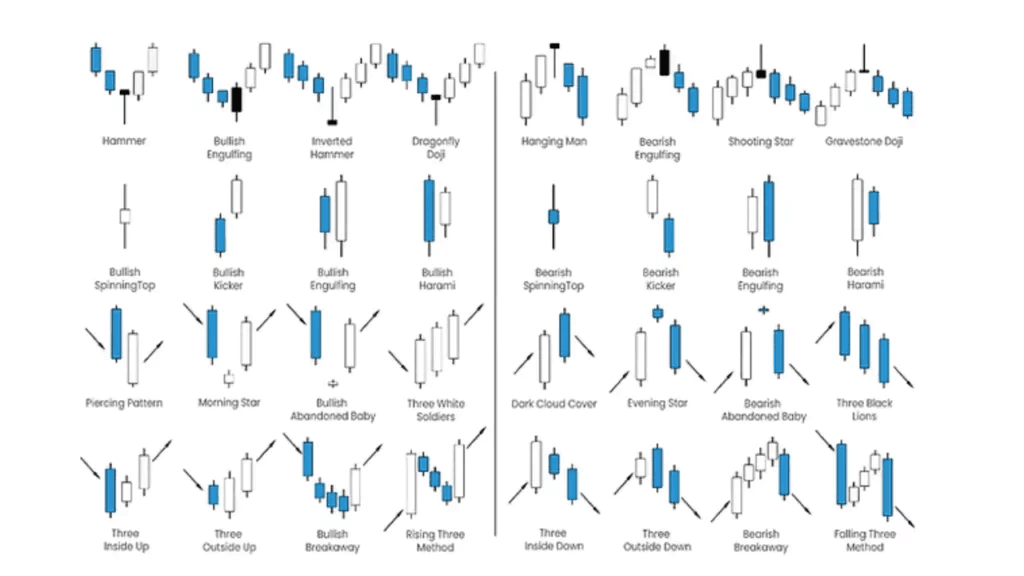
- Doji: This candle has a very small body, almost like a thin line. The open and close are nearly identical. This indicates the market is indecisive, with buyers and sellers balanced. It often signals a reversal if it occurs after a long trend.
- Hammer: Small upper body, lower wick twice as long or longer. Appears after a downtrend, signaling a bullish reversal. Buyers are starting to push the price up strongly.
- Shooting Star: The opposite of a hammer. Small lower body, long upper wick. Appears after an uptrend, signaling a bearish reversal. Sellers are beginning to take control of the market.
- Marubozu: A candle with no or very small wick. The body is full. Green indicates a very strong uptrend. Red indicates a strong downtrend.
- Bullish Engulfing: Two candles. The first candle is red, the second is green, and their bodies completely cover the first. This is a strong signal that a downtrend may reverse to an uptrend.
- Bearish Engulfing: The opposite of a bullish engulfing. The first candle is green, the second is red, and it engulfs the first candle. This signals a possible bearish trend reversal.
- Morning Star: A three-candle pattern. The first candle is long red, the second is small (a doji), and the third is green, closing above the middle of the first candle. A fairly strong bullish reversal signal.
- Evening Star: The opposite of the morning star. The first candle is green, the second is small, and the third is red, closing below the middle of the first candle. This signals a bearish reversal.
- Three White Soldiers: Three consecutive green candles with increasingly larger bodies. Signaling a strong uptrend after a downtrend.
- Three Black Crows: Three consecutive red candles with increasingly larger bodies. Signals a strong downtrend after an uptrend.
New to crypto investing? Bitcoin (BTC) and Ethereum (ETH) are among the most popular starter cryptocurrencies to explore and trade on Bittime.
When it comes to candlestick chart reading strategies, don't use this pattern alone. Always consider the context of the larger trend and confirm it with trading volume.
In crypto, patterns like hammers often appear at support levels. Practice on a demo account first to get used to it.
Read also:A Complete List of Profitable Investments with Small Capital in 2026
Practical Crypto Candlestick Analysis Strategy in Daily Trading
Now let's get to the practical part. Candlestick chart reading strategies aren't complicated as long as they're done regularly. First, determine the timeframe. Beginners usually start with daily or 4-hour timeframes to see clearer patterns and minimize noise.
Second, identify the overall trend. If prices are generally rising, look for bullish patterns like hammers or bullish engulfing patterns to enter a buy position. Conversely, in a downtrend, bearish patterns are more relevant.
Third, use patterns as confirmation signals, not as primary decisions. For example, if you see a doji at the top of an uptrend, don't sell immediately. Wait for the next candle to turn red and close below the doji. Only then will the signal be stronger.
Fourth, manage risk effectively. Place a stop-loss below the low of the hammer candle if you buy. The profit target can be the nearest resistance or a 1:2 risk-reward ratio.
When analyzing crypto candlesticks, remember that the market is 24 hours a day and highly volatile. Patterns that emerge over the weekend are sometimes less accurate. Trading during the London or New York sessions is best for high liquidity.
Interested in getting started with crypto investing? Learn how to buy Bitcoin (BTC) or Ethereum (ETH), one of the most popular coins for beginners!
Many successful traders combine candlestick patterns with support and resistance levels. Draw horizontal lines at price levels that are frequently rejected. If a hammer pattern appears right at support, a buy opportunity is greater.
Practice every day. Open a Bitcoin or Ethereum chart, note the patterns that emerge, and then check to see if the signal is correct on the next candle. In two weeks, you'll be much more proficient.
Read also:What Is Market Liquidity? Definition, How It Works, and Its Impact on the Crypto Market
Conclusion
Correctly reading candlestick trading takes practice, but the results are well worth it. By understanding the body, wick, and basic patterns, you can make better decisions in the crypto or stock markets.
Remember, no method is 100% accurate, so always manage your risks and keep learning. Hopefully, this guide helps you start learning candlestick trading with confidence. Practice now on your favorite chart. Happy trading!

For beginners, choosing a cryptocurrency with strong fundamentals and adoption can be a more comfortable first step toward starting to invest.
Bittime is a licensed and regulated Digital Financial Asset Trader (PAKD) supervised by Indonesia’s Financial Services Authority (OJK) — where you can buy Bitcoin in Indonesia and hundreds of other crypto assets starting from just Rp10,000. The registration process is fast, secure, and you can get started today.
Track USDT to IDR conversions and monitor your favorite crypto assets in real time. Everything is available in one crypto investment app that you can download for free on the Play Store
Ready to start? Register now on Bittime and execute your investment strategy with a platform trusted by millions of users in Indonesia.
FAQ
What is the difference between green and red candlesticks?
A green candlestick means the closing price was higher than the opening, indicating a bullish trend. A red candlestick means the closing price was lower, indicating a bearish trend.
Which candlestick pattern is the easiest for beginners?
Doji and hammer are the easiest because they're simple and frequently occurring. Start with those.
Are candlesticks enough for crypto trading?
It's not enough on its own. Combine it with other indicators like the RSI or support/resistance indicator for more accurate signals.
What is the best timeframe to read candlestick patterns?
For beginners, use a 1-hour or 4-hour timeframe. Patterns are clearer and don't change as quickly.
How to practice reading candlesticks for free?
Open TradingView, select a crypto asset, switch to candlesticks, and then observe the pattern daily without real trading.
Disclaimer: The views expressed belong exclusively to the author and do not reflect the views of this platform. This platform and its affiliates disclaim any responsibility for the accuracy or suitability of the information provided. It is for informational purposes only and not intended as financial or investment advice.

.png)