BTC Enters Accumulation Phase: Will Bitcoin Price Surge Soon?
2026-10-28
Bitcoin is showing signs of recovery, but does the accumulation phase mean a price surge is imminent? Galaxy Research believes the Bitcoin bear market will end in June 2026, and the market is beginning to lay the foundations for the next bull run.
This view relies on improving trends and easing selling pressure, not the certainty of a rally in a few days.
To understand the potential for BTC price increases, readers need to distinguish three things: evidence of recovery, confirmation of a bullish trend, and the timing of the increase.
The three are interrelated, but do not always appear together.
Key Takeaways
Galaxy believes Bitcoin is entering an accumulation phase, but that conclusion remains a market thesis.
The weekly trend recovery supports optimism, while the sideways price movement has not yet confirmed a breakout.
Bitcoin price predictions need to include cancellation conditions, not just upside targets.
Why Does Galaxy Think the Bitcoin Bear Market Is Over?
Galaxy Research believes Bitcoin is entering an accumulation phase after showing an improving trend on the weekly chart.
The basis for this view is BTC's ability to re-establish itself above its 50-week moving average (MA), after previously being below it for 44 weeks.
This change reinforces the suspicion that selling pressure is starting to ease and the market is building the foundations for a recovery.
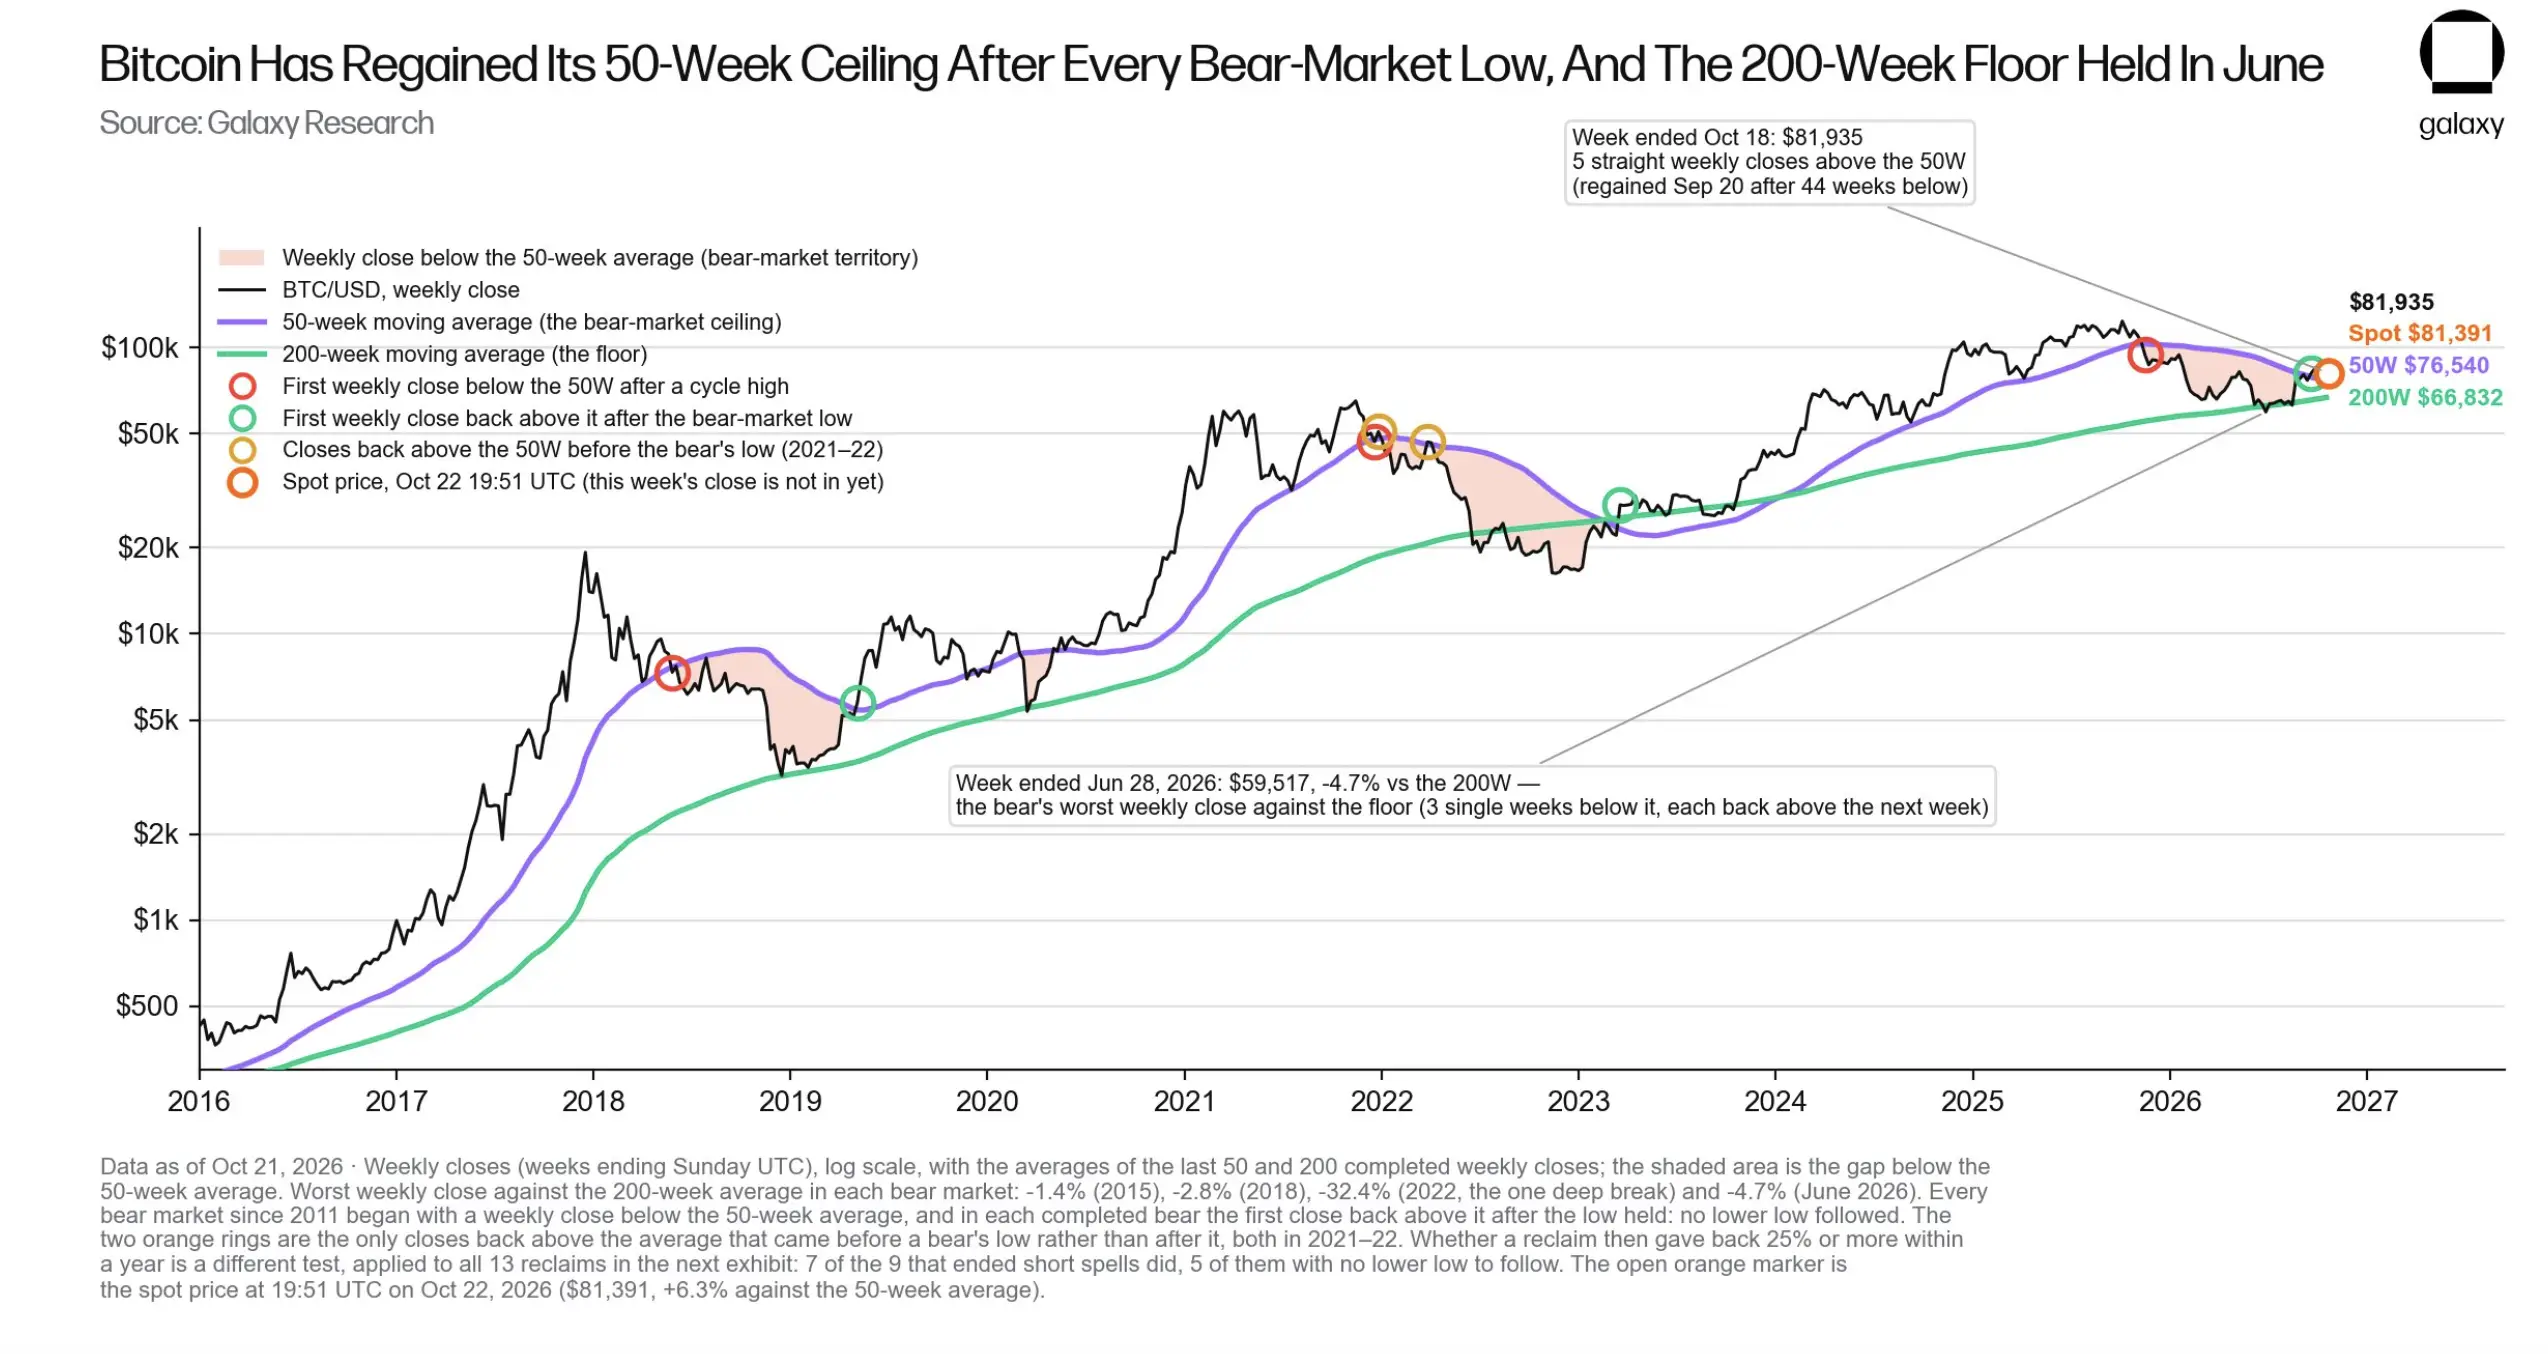
Source: Galaxy Digital in dailyhodl.com
On the Galaxy chart, the black line shows Bitcoin's weekly closing price, while the purple line depicts the 50-week moving average.
During a bear market, the purple line serves as a reference for price resistance.
When BTC manages to break through and hold for a few weeks, the recovery signal is stronger than a short-term surge.
Read Also: Convert 1 BTC to IDR - Bitcoin to Indonesian Rupiah Exchange Rate
Five Weekly Closes Strengthen Recovery Signals
Bitcoin closed above its 50-week moving average again in the week ending September 20, 2026.
As of October 18, 2026, BTC has recorded five consecutive weekly closes abovethe indicator, with the last closing price ofUS$81.935.
This closing series is a key part of Galaxy's latest Bitcoin analysis.
The price not only broke through the moving average but also maintained its position for several weeks. This situation supports the view that seller dominance is weakening, although it doesn't yet prove that the rally will continue without a correction.
Read Also: Bittime: Beli Bitcoin & Trading Futures Crypto
The 200-Week MA is a benchmark for price resilience.
The green line on the chart represents the 200-week moving average (MA). Galaxy uses it as a long-term price support reference when Bitcoin experiences pressure.
In the week ending June 28, 2026, the closing price of Bitcoin was atUS$59.517, around 4.7% below the 200-week MA at the time.
The chart recorded three weekly closes below those indicators, but each returned upwards the following week.
This means that this support area was broken through, but the price did not continue to stay below it.
Let's start trading crypto from the biggest assets such as BTC/IDR and ETH/IDR directly in the Bittime app.
Does This Signal Mean Bitcoin Will Soon Be Bullish?
The combination of a recovery above the 50-week moving average and resistance around the 200-week moving average underpins Galaxy's view that the Bitcoin bear market is over.
The pattern supports the scenario of an accumulation phase before the next rally, but the price chart alone doesn't directly show who is buying or how much BTC is being accumulated.
The chart also shows that in 2021–2022, prices briefly returned above the 50-week moving average before the bear market bottom was reached.
Therefore, one breakout is not enough to confirm a trend change.
For readers asking whether Bitcoin will go up, the message of this chart is that the price structure is improving.
The potential for BTC price increases still requires further confirmation through the ability to maintain recovery and form a more consistent uptrend, rather than simply relying on historical patterns.
Let's monitor a number of gold and silver-based digital assets such as XAUT, PAXG and SLVON. All three are now available on Bittime!
Bitcoin Accumulation Phase: How Is It Different from Bullish?
The term Bitcoin accumulation phase describes the condition when gradual purchases absorb supply, while prices have not yet formed a clear increase.
In the Bitcoin accumulation phase, the market can move sideways because buyers and sellers are still balancing each other.
Sideways movement itself doesn't necessarily indicate accumulation. A similar chart pattern can also emerge when asset holders release ownership to new buyers.
The difference requires confirmation from price and demand developments.
The table is a framework for reading the market, not an automated trading signal.
One bullish candle or one high volume day is not enough to confirm a trend change.
Want to have exposure to American stocks?Register at Bittime and start investing through tokenized stocks.
Could the Accumulation Phase Push Bitcoin Prices Higher?
The accumulation phase can be the foundation for an upswing as buying gradually absorbs the supply being sold.
If selling pressure weakens while demand persists or increases, the chances of Bitcoin's price moving up become greater.
However, this process does not determine when the increase will begin.
In Galaxy's analysis, Bitcoin's recovery above its 50-week moving average is one of the reasons for the positive outlook.
This signal indicates an improvement in the trend, but does not guarantee that the price will immediately jump.
The next confirmation is BTC's ability to break through the upper limit of the trading range and hold thereafter.
An increase accompanied by strong trading volume will strengthen the suspicion that buyers are starting to dominate the market.
So, the potential for BTC price increases remains open, but the term “accumulation” is best understood as the phase of forming a recovery base.
As long as the price remains sideways without a sustained breakout, the immediate bullish Bitcoin scenario has not yet received strong confirmation.
Read Also: How to Stake USDT on Bittime in 4 Easy Steps
Will Bitcoin Rise After Selling Pressure Eases?
TradingView reports monthly movements of coins that were previously inactive for at least five months.year down from an average of 67,000 BTC in 2024 to 34,000 BTC in 2026.
The data supports the discussion of the reduced distribution of old coins.
However, coin movement doesn't always translate into sales on exchanges. Reduced movement doesn't automatically translate into new demand.
In conclusion, weakening selling pressure could facilitate a recovery if buying persists.
If demand also falls, prices can remain stable even if the number of sellers decreases.
Read Also: What is Trading? Definition, How It Works, and How It's Different from Investing
What Could Derail the BTC Bull Scenario?
Galaxy cited a weekly close below the 50-week average, with no recovery in a month, as conditions that weaken its thesis.
The reference level in the report is around US$76,540, but the moving average value changes as time.
This means that the latest Bitcoin analysis should update indicators, rather than relying on outdated figures. Changes in demand and liquidity conditions could also make the recovery slower than expected.
The accumulation phase supports the possibility of an uptrend, but doesn't yet answer the question "soon." Price confirmation is more useful than assuming a repeat of a historical pattern is a definite timetable.
To monitor BTC in rupiah, register on Bittime and check the prices, fees, and transaction features available before making a decision.

Bittime is a licensed and regulated Digital Financial Asset Trader (PAKD) supervised by Indonesia’s Financial Services Authority (OJK) — where you can buy Bitcoin in Indonesia and hundreds of other crypto assets starting from just Rp10,000. The registration process is fast, secure, and you can get started today.
Track USDT to IDR conversions and monitor your favorite crypto assets in real time. Everything is available in one crypto investment app that you can download for free on the Play Store
Ready to start? Register now on Bittime and execute your investment strategy with a platform trusted by millions of users in Indonesia.
FAQ
What is Bitcoin accumulation phase?
A phase where buying absorbs supply without a clear price increase. Identifying it requires more than just a sideways chart.
Is the Bitcoin bear market over?
Galaxy assesses this. However, this view could still change if recovery indicators fail to hold.
Will Bitcoin go up after accumulation?
Increases are possible if demand strengthens. Accumulation does not guarantee the timing, magnitude, or elimination of downside risk.
What is the next Bitcoin price prediction?
This article does not set any specific targets. Report data and calculation examples should not be construed as price promises.
Does sideways price mean Bitcoin will be bullish soon?
No. Price needs to demonstrate the ability to break through the range and sustain gains to strengthen the bullish scenario.
Disclaimer: The views expressed belong exclusively to the author and do not reflect the views of this platform. This platform and its affiliates disclaim any responsibility for the accuracy or suitability of the information provided. It is for informational purposes only and not intended as financial or investment advice.

.png)