Bitcoin Holds Above 200-Week MA, Failing to Break Next Support at $54,000
2026-07-28
Bitcoin is currently at a critical crossroads, holding around the 200-week moving average which has historically been a long-term indicator of market direction.
This level, which is in the $62,000-$64,000 range, has marked the bottom of the bearish cycle since 2015.
If this level fails to hold, analysts expect the next support to be in the $54,000 zone, which is the network's realized price, the average cost of acquiring all Bitcoins in circulation.
Key Takeaways
Bitcoin is currently holding above its 200-week moving average around $62,000-$64,000, a level that has historically marked the bottom of bearish cycles since 2015.
If the 200-week MA fails to hold, the next support level analysts are watching is the network's realized price around $54,000.
Analysts suggest an accumulation strategy in the $54,000-$64,000 range rather than waiting for a perfect bottom, as this level is considered an attractive long-term buying zone.
What Is Bitcoin's 200-Week MA?
The 200-week MA is the average of Bitcoin's closing prices over the past 200 weeks, which filters out short-term volatility to reveal the long-term trend.
This level has been a very strong support in every Bitcoin bearish cycle since 2015, including in 2018 and 2020.
Currently, the 200-week moving average is around $62,000-$64,000, with Bitcoin managing to hold above it despite testing it several times.
Monitor Bitcoin movements and manage your digital portfolio. Register at Bittime, a trusted crypto trading platform in Indonesia
Why is the 200-Week MA Important for BTC Price?
The 200-week MA is not just a line on a chart, it represents long-term market psychology.
When Bitcoin is above the 200-day moving average, buyers over the past four years have been in profit, which tends to encourage bullish sentiment.
Conversely, if Bitcoin falls below the 200-day moving average, it would mean that the average buyer over the past four years is in a losing position, which historically triggers a capitulation phase and the formation of a bottom.
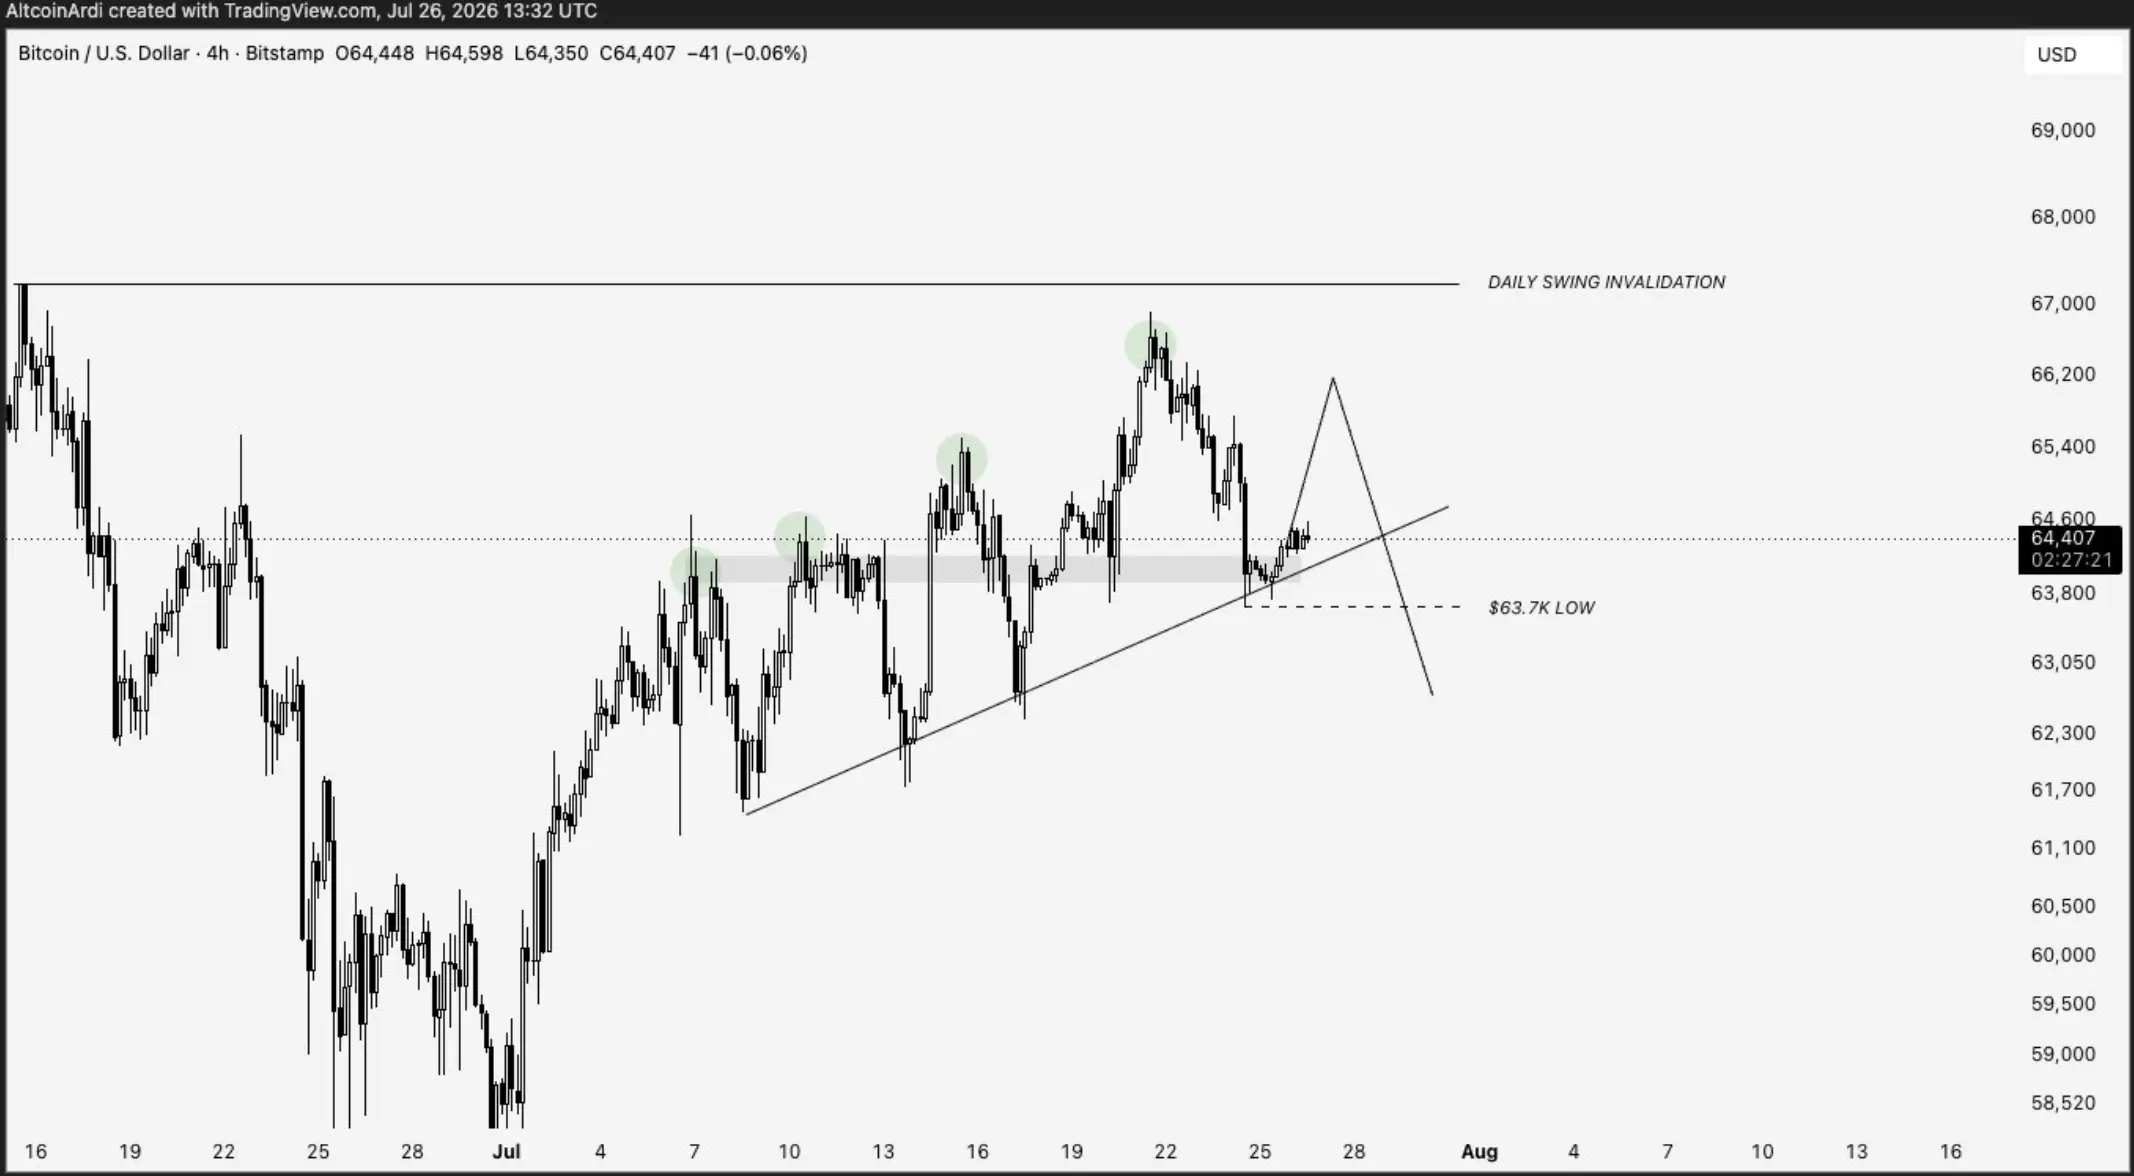
Source: X/@ArdiNSC
According to analyst Benjamin Cowen, "This is what Bitcoin does... about every four years, Bitcoin has a rendezvous with destiny, and that destiny is the 200-week moving average."
Read Also: How to Buy Bitcoin (BTC) | BTC to IDR | BTC to USDT
What Does It Mean If Bitcoin Fails to Hold the 200-MA?
If Bitcoin fails to stay above the 200-week moving average and closes below this level on a weekly basis, the next support level to be tested will be the realized price around $54,000.
Realized price is the average cost of acquiring all Bitcoins circulating on the network.
In every previous bearish cycle, Bitcoin at least briefly fell below the realized price before forming a bottom.
On-chain data shows that whales (holders of 10,000-100,000 BTC) have a realized price of around $54,300, while the largest holders (>100,000 BTC) have an average price of under $49,000.
This means the $54,000 zone is an area where large holders will likely maintain their positions.
Read Also: Profit-Making Strategies in Crypto Futures and How to Calculate Profits
Why Is $54,000 the Next Support?
The $54,000 zone is in the spotlight for several reasons:
1. Network Realized Price
This is the average cost of acquiring all Bitcoins in circulation, which has historically been the last support before a bottom.
2. Psychological Level
CryptoQuant analyst Axel Adler Jr. called $54,000 the "final resistance of this cycle." If Bitcoin remains above $54,000, a correction is still considered normal; if it falls below $54,000, full capitulation could occur.
3. Average Whale Cost
Large holders (10,000-100,000 BTC) have an average cost of around $54,300, so they will likely defend this level.
Read Also: How to Stake BTC on Bittime in 4 Easy Steps
Strategies for Dealing with This Situation
Doctor Profit analysts emphasize an accumulation strategy in the $54,000-$64,000 range rather than waiting for a perfect bottom:
"People who keep waiting for the right bottom usually end up buying at a much higher price, or not buying at all.
I'm not here to gamble on one perfect number. I'm here to dominate ranges, building strong entry averages."
Start trading BTC/IDR with Bittime here!
Key Levels to Monitor
- Resistance:$66,500-$67,000 (previous high).
If Bitcoin breaks through this level, the next target is $69,000-$70,000.
- Support: $62,000 (200-week moving average). If broken, target $54,000.
- Deeper Support:$49,000-$50,000 (average cost of long-term holder).
Read Also: How to Buy Bitcoin with DANA on Bittime
Conclusion
Bitcoin is currently in a critical decision zone around the 200-week moving average (MA). If this level holds, there's a chance of a rebound towards $66,500-$70,000.
However, if it fails, $54,000 becomes the next support to test.
For long-term investors, the $54,000-$64,000 zone is considered an attractive accumulation area, with a DCA (Dollar Cost Averaging) strategy to build a strong entry average.

Bitcoin is now available and ready for trading on Bittime via the BTC/USDT pair; in addition, there are other assets on the Bitcoin BRC20 network, such as SATS and ORDI.
Bittime is a licensed and regulated Digital Financial Asset Trader (PAKD) supervised by Indonesia’s Financial Services Authority (OJK) — where you can buy Bitcoin in Indonesia and hundreds of other crypto assets starting from just Rp10,000. The registration process is fast, secure, and you can get started today.
Track USDT to IDR conversions and monitor your favorite crypto assets in real time. Everything is available in one crypto investment app that you can download for free on the Play Store
Ready to start? Register now on Bittime and execute your investment strategy with a platform trusted by millions of users in Indonesia.
FAQ
What is Bitcoin's 200-week MA?
The 200-week MA is the average of Bitcoin's closing prices over the past 200 weeks, which has historically been a key support level in bearish cycles.
Why is the 200-week MA important?
This level marks the bottom of the bearish cycle since 2015 and serves as a psychological benchmark for long-term investors.
What happens if Bitcoin fails to hold the 200 MA?
If it breaks, the next support is the realized price at around $54,000.
Why is $54,000 an important support?
Because this is the average cost of acquiring all Bitcoins (realized price) and the area where whales have average costs.
What is the best strategy in this zone?
Analysts suggest gradual accumulation in the $54,000-$64,000 range with a DCA strategy.
Disclaimer: The views expressed belong exclusively to the author and do not reflect the views of this platform. This platform and its affiliates disclaim any responsibility for the accuracy or suitability of the information provided. It is for informational purposes only and not intended as financial or investment advice.

.png)