Bitcoin Plummets Below $80,000 at the End of January 2026: Causes, 80K Support, This Week's Predictions
2026-02-01
In this introduction, let’s get straight to the point: Bitcoin slid and briefly traded below 80,000 toward the end of January 2026. On the intraday chart, today’s Bitcoin price has been moving around the 78K range, triggering a big question:
is this a normal crypto market pullback, or a signal of a deeper downtrend? The solution isn’t guesswork—it’s understanding why Bitcoin is falling, testing the Bitcoin support level at 80,000, and preparing clean risk management.
Below, I summarize an easy-to-follow Bitcoin analysis for 2026, complete with scenarios for this week’s outlook so you can make calmer decisions. That way, your buy, sell, or wait decisions become more measured.
Key Takeaways
- A break below the 80K area often triggers follow-through selling due to psychology and cascading stop-loss orders.
- Risk-off sentiment makes risk assets like crypto more prone to pullbacks.
- Focusing on levels, scenarios, and risk is more useful than chasing a “magic number forecast.”
What Happened in Late January 2026?

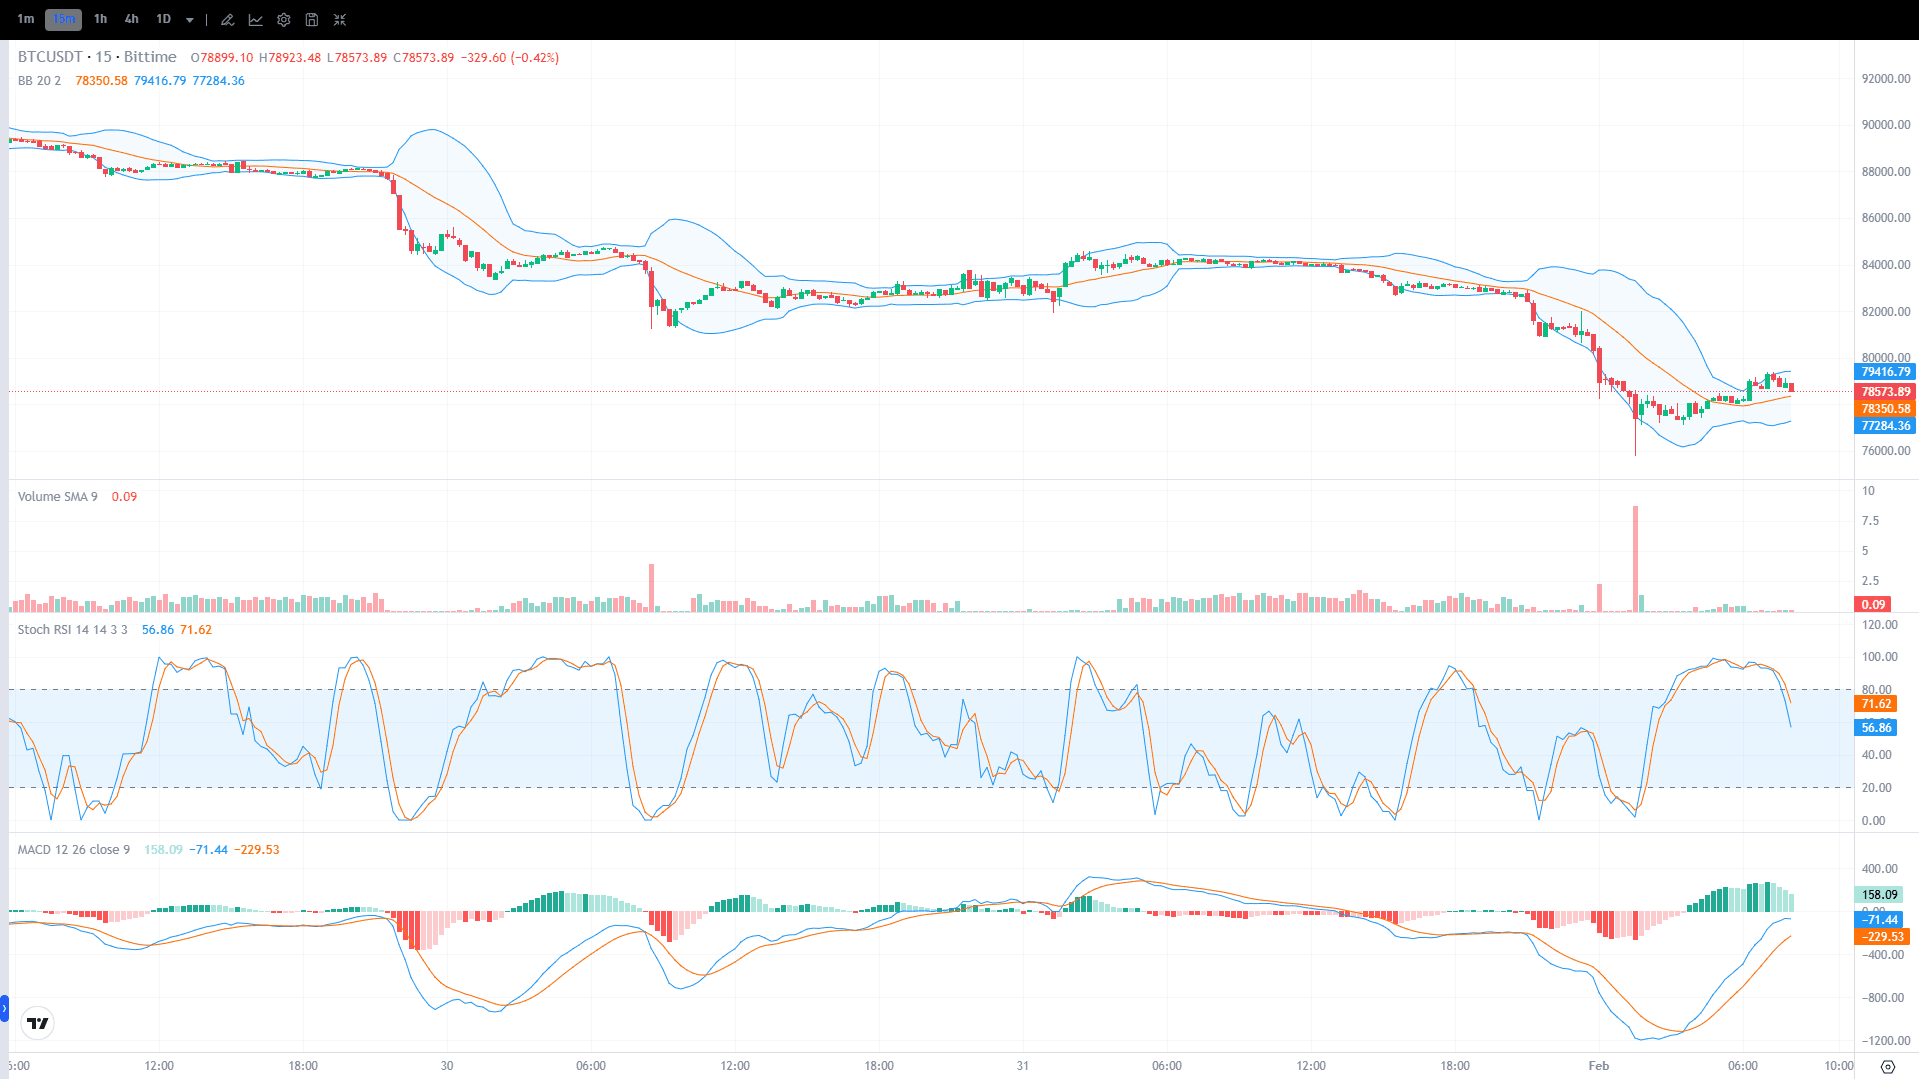
In late January 2026, intraday price action showed heavy selling pressure, with BTC briefly stabilizing around the 78K area. On the 15-minute BTC/USDT chart, price moved below the psychological 80K zone and then attempted to bounce.
Patterns like this often appear when the market is “on edge,” as participants react quickly to the break of a key level—not necessarily because of a single trigger.
Technically, volatility expanded and then cooled, a sign the market is searching for a new equilibrium after the drop.
For casual readers, remember this: when price falls quickly, the market usually does two things—it panics first, then “re-tests” the newly broken area to see whether the bounce is strong or just a pause before another leg down.
- Bollinger Bands (a volatility indicator): upper band around 79.4K, midline around 78.35K, lower band around 77.28K. Price sitting near the midline suggests the market is trying to stabilize.
- Volume spiked during the drop, signaling real selling pressure rather than a slow drift lower.
- Stoch RSI (momentum): moved into the mid-to-upper area, hinting at a bounce—but not automatically a confirmed reversal.
- MACD (trend direction): started improving from a low, but it’s better read as a “short-term recovery” until a key resistance is clearly reclaimed.
Also Read: Crypto Trading Strategies for Beginners—Don’t Do This!
Why Bitcoin Fell: A Mix of Technical and Psychological Factors
If you ask, “What caused Bitcoin to drop?”, the safest and most useful answer is usually: a combination. There are technical factors (levels breaking, liquidations, stop-loss triggers) and psychological factors (fear of being late to sell, overall market anxiety).
When Bitcoin drops, leveraged positions get squeezed, and forced closures can accelerate the decline. At the same time, round numbers like 80K trigger emotional reactions because they’re easy to remember and often used as a crowd reference point.
Also important: when the market shifts into risk-off sentiment mode (investors lean toward assets seen as safer), risk assets like crypto become more vulnerable to broader pullbacks.
So while triggers can vary, the mechanism often looks similar: a level breaks → selling increases → volatility jumps → the market searches for a new floor.
The 80,000 Bitcoin Support Level Was Broken
- 80K often acts as a psychological “defense line,” so when it breaks, sell orders and stop-losses can stack up quickly.
- After the break, that area often flips into resistance (an upper ceiling) that can be hard to reclaim quickly.
Risk-Off Sentiment Amplified the Pullback
- In a risk-off phase, market participants tend to reduce exposure to volatile assets.
- As a result, bounces can be shorter-lived and easier to break down.
The Leverage and Liquidation Effect
- When price moves quickly, leveraged positions are more likely to face margin calls.
- Liquidations add extra sell pressure that accelerates the drop—even without any “big news.”
Also Read: 7 Effective Ways to Trade Crypto for Beginners, Complete with Tips and Tricks
Bitcoin Analysis 2026: Key Levels and This Week’s Outlook
For a practical Bitcoin analysis for 2026, the goal isn’t to guess the top or bottom—it’s to read the zones. From the latest move, the 77K–78K area looks like the nearest floor, while 79K–80K is the key test zone.
If price fails to reclaim 80K, the market may view the bounce as temporary. On the other hand, if 80K is broken and held, the odds of a short-term recovery improve.
The “sane” approach is to prepare scenarios and risk rules. For example: set your loss limit before entering, avoid oversized positions, and don’t force leverage when volatility is high.
This matters because this week’s Bitcoin outlook should be read as possibilities—not certainties.
Bullish Scenario (Strong Bounce)
- Price holds above the 78K zone, then breaks 79.4K and tests 80K.
- A safer confirmation is a breakout supported by healthy volume—not just a brief spike.
Bearish Scenario (Further Decline)
- Price fails to reclaim 79K–80K and presses back toward 77.3K.
- If 77K breaks, market attention typically shifts to the next lower support area.
Sideways Scenario (Consolidation)
- Price chops back and forth within the 77.3K–79.4K range.
- This phase is often the “best time” to stay disciplined, because many traders get baited into repeated entries without a plan.

Conclusion
Bitcoin’s drop and the brief move below 80,000 in late January 2026 was a moment that tested discipline—not just analysis.
By understanding why Bitcoin fell, reading the 80,000 support area, and recognizing risk-off sentiment, you can turn panic into a plan. Remember, this is not investment advice, but a thinking framework to make decisions more measured.
To monitor the market and make calmer decisions, you can check the market and execute trades on Bittime Exchange. For lighter, more educational daily updates, continue reading crypto news on Bittime Blog.
FAQ
Why can Bitcoin plunge without a single major headline?
Often, declines are driven by market mechanics such as key level breaks, stop-loss triggers, and leverage liquidations. Psychological factors can turn the move into a chain reaction.
What does risk-off sentiment mean for day traders?
Risk-off means market participants reduce exposure to risky assets. In this condition, bounces can fail quickly and volatility tends to stay elevated.
Where are the key support levels to watch around 80,000?
Beyond the 80K area, watch the nearest zones below it (around 78K and 77K in the latest move). Exact levels should be adjusted to the timeframe you use.
Does a crypto market pullback always mean a long downtrend?
Not always. A pullback can be a reset phase before consolidation or recovery, but it needs confirmation—typically by reclaiming and holding key resistance levels.
How should you approach this week’s Bitcoin outlook more safely?
Use scenarios, not certainty. Set your loss limits, choose a reasonable position size, and avoid impulsive decisions when volatility is high.
Disclaimer: The views expressed belong exclusively to the author and do not reflect the views of this platform. This platform and its affiliates disclaim any responsibility for the accuracy or suitability of the information provided. It is for informational purposes only and not intended as financial or investment advice.

.png)