What Is XTruth Oil (XTO) Coin? Check Price, Risks, and How to Claim
2026-10-26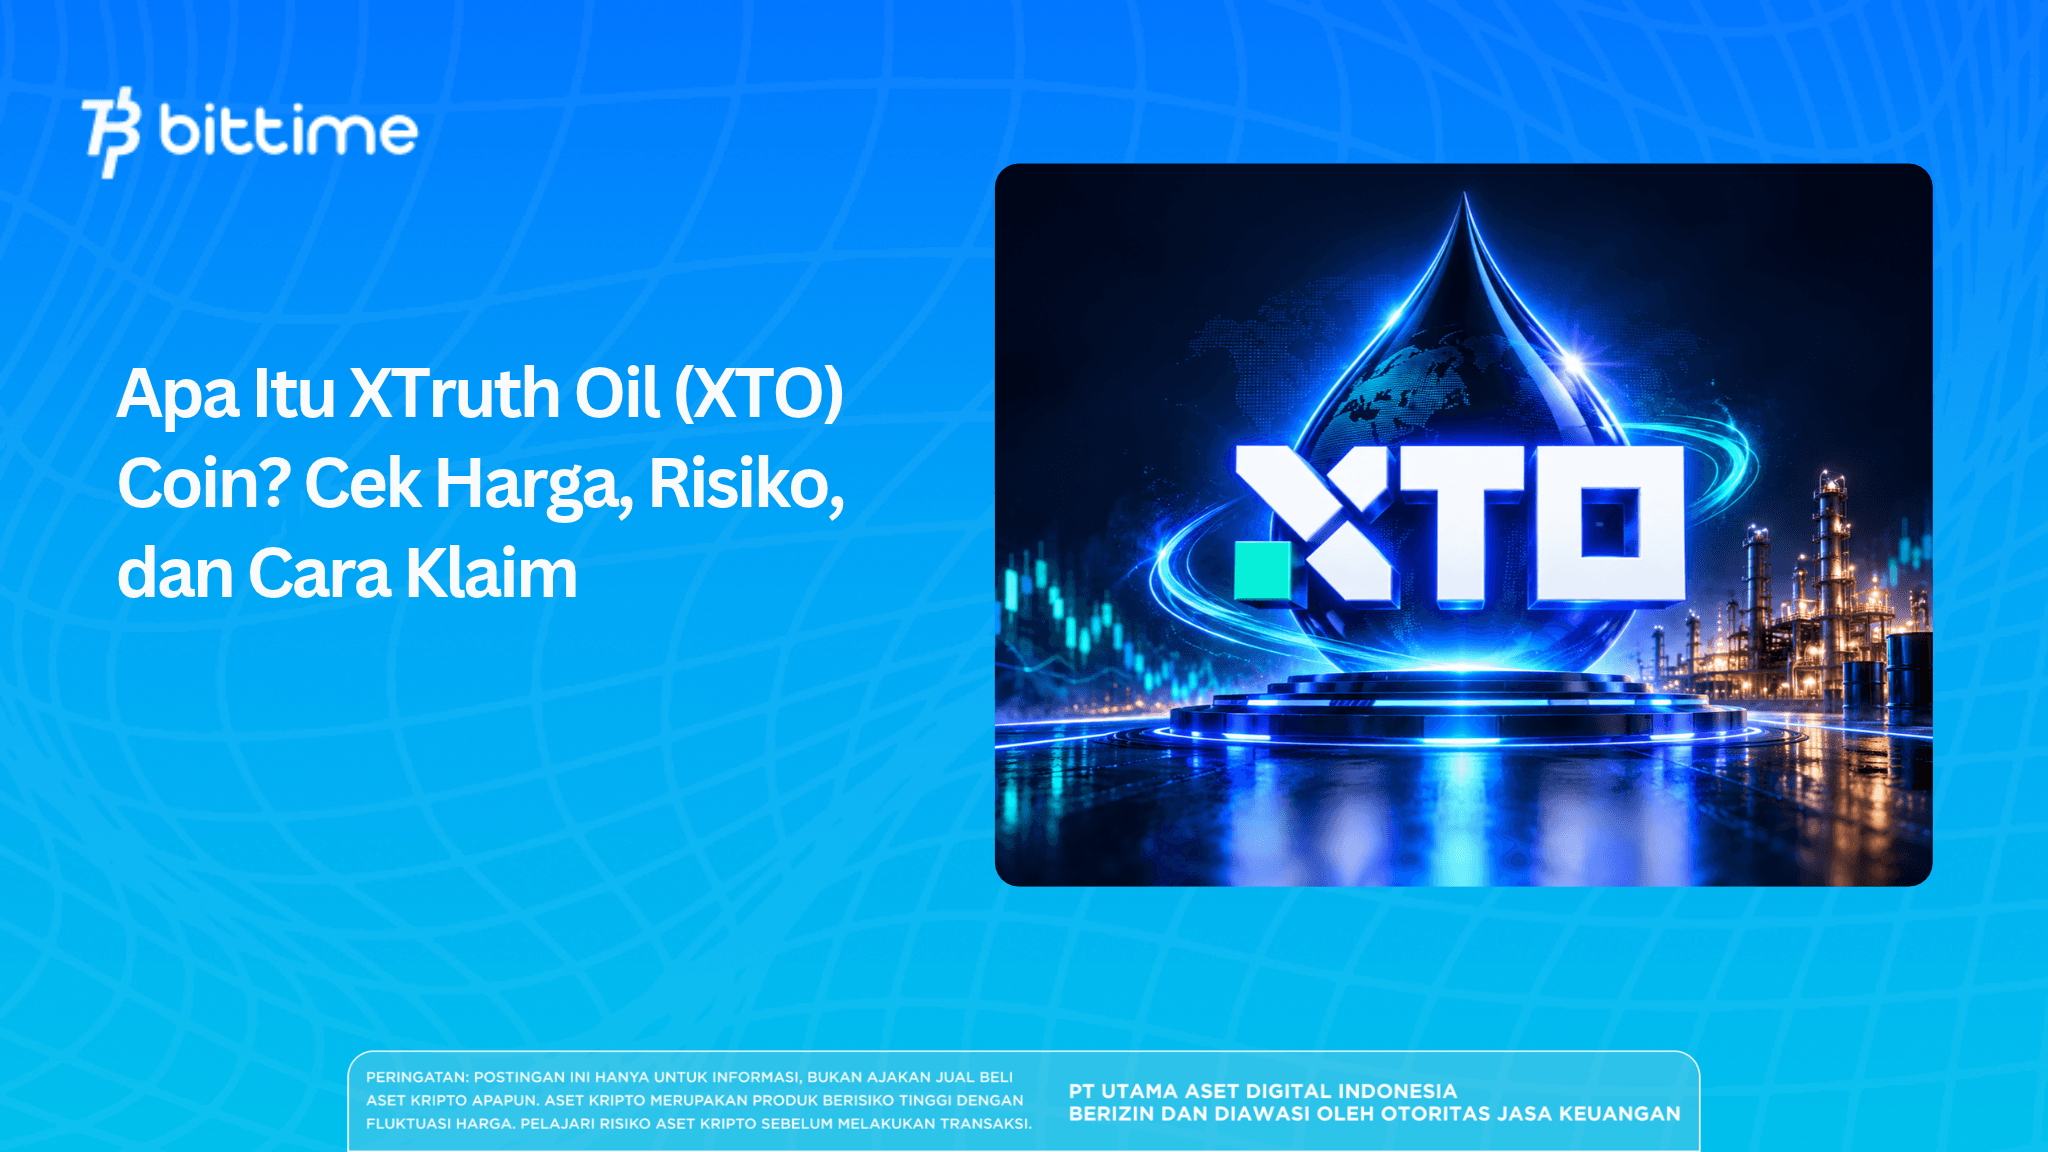
What is XTO coin? XTruth Oil, or XTO, is a token on the Solana network that promotes USOon rewards for its holders. In the market screenshot used as a reference for this article, the XTO price summary shows US$0.0117, but a price increase alone does not establish the project's quality.
To assess XTruth Oil, you need to understand its reward mechanism, examine trading conditions, and confirm the token's identity. The following discussion distinguishes between screenshot data, historical findings through October 21, 2026, and matters that still require examination.
Key Takeaways
- The screenshot shows an XTO price of US$0.0117, an FDV of US$11.7 million, liquidity of US$272.3 thousand, and 24-hour trading volume of US$139.2 thousand.
- XTruth Oil's mechanism relies on trading fees to fund rewards, so returns need to be assessed alongside price changes and transaction costs.
- Contract identity, liquidity depth, and distribution consistency are more useful for evaluation than the token's name or a security label alone.
What Is XTO Coin, or XTruth Oil?
XTruth Oil is a Solana token project built around an oil-related asset narrative. The project promotes the distribution of USOon, a tokenized product linked to the United States Oil Fund.
Holding XTO is not the same as owning an oil well or receiving profits from a drilling company. Its connection to oil-related assets needs to be understood through the reward mechanism and the product's terms.
Before assessing a token's benefits, separate three things: the asset being purchased, the rights acquired, and the party operating the mechanism. Promotional materials alone do not establish all these relationships.
Read also: What Is MUB? Understanding the Micron Stock Token and How It Works
XTO Price Based on the Market Screenshot
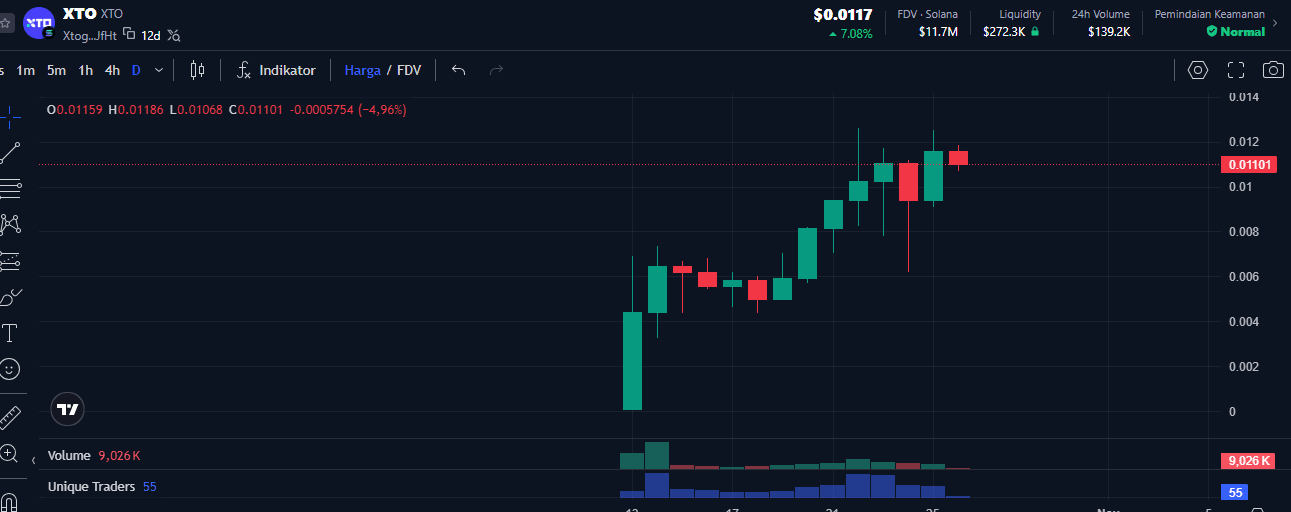
The market summary in the image shows:
- Price: US$0.0117.
- Price change: up 7.08% on the summary indicator.
- FDV: US$11.7 million.
- Liquidity: US$272.3 thousand.
- 24-hour trading volume: US$139.2 thousand.
- Chart timeframe: daily, or D.
The 7.08% increase does not have a clearly readable period label in the image. This article therefore does not describe it as a daily increase.
FDV indicates a valuation based on price and fully diluted supply. The US$11.7 million figure is not the amount of funds available for all holders to cash out.
Why Do the Summary Price and Candlestick Differ?
The displayed candlestick data shows an open of US$0.01159, a high of US$0.01186, a low of US$0.01068, and a close of US$0.01101. The candlestick recorded a decline of 4.96% from its opening price.
The difference from the summary price of US$0.0117 may relate to data updates or the selected candlestick. The screenshot does not provide enough information to establish the cause.
Accordingly, the summary price is used to describe the market snapshot, while the candlestick data is used to interpret movement within that candlestick. They are not combined into a single closing price.
Read also: What Is SNDKB? Understanding SanDisk Tokenized bStocks
How Should You Read XTO's Chart Movements?
Visually, the candlestick sequence shows a rise from a lower price area toward approximately US$0.011. However, several candlesticks have long wicks, indicating that prices moved significantly away from their opening or closing levels.
The visible history is still short. The following levels are estimated visual zones, rather than support and resistance levels tested across many market cycles.
Areas to Monitor
The US$0.010–US$0.0107 zone is the nearest area to watch for the price's ability to hold. Its upper boundary is close to the low of the displayed candlestick.
The US$0.0118–US$0.0125 zone is the nearest resistance area because it includes several recent candlestick highs. A move beyond this area needs to be assessed alongside candlestick closes and changes in volume.
If selling pressure increases, approximately US$0.008 becomes the next reference area from the previous upward structure. The price does not necessarily have to stop or rebound at that level.
This interpretation describes scenarios, not a certain prediction. Without data from after the screenshot was taken, it is not possible to confirm whether the price held or broke through these zones.
Read also: What Is KIMCHI Coin? Understanding the Aura Final Boss Token
How Do XTruth Oil Rewards Work?
According to the promoted mechanism, a 4% trading fee is used to buy USOon and then distribute it to holders. Distributions are funded by XTO transaction activity, rather than oil operating revenue.
To evaluate this, you need to know the basis on which the fee is charged, recipient eligibility, and how distribution shares are calculated. The fee percentage alone is not enough to estimate what a wallet will receive.
A simple simulation: a position worth US$100 falls to US$75, while the rewards received are worth US$3. The combined value is US$78 before fees, so the overall result remains a loss of US$22.
This example is not an actual XTO holder's result. It illustrates why rewards need to be calculated alongside changes in capital value, rather than assessed separately.
Is XTO Coin Legit or a Scam?
Historical observations from October 14–21, 2026 recorded approximately US$85,000 in USOon distributed to 1,990 wallets. Payments appeared in 78 of the 168 observation hours, with two gaps lasting 29 and 34 hours.
These findings show that payments had taken place, but they did not occur every hour without interruption during that period. This historical record also does not explain conditions after October 21.
The question “is XTO coin legit” therefore requires a clear definition. The token's existence, payment execution, system security, and model sustainability are separate aspects.
The “Normal” label on the security scan in the screenshot does not explain the scope of its checks. That label cannot be used as proof that the price is stable, the operators are trustworthy, or all risks have been examined.
XTO Contract Address and How to Check It
The address used as the reference for XTruth Oil in this article is:
XtogpWjiAgvkemc5gr1auxkh77w3vKgSQN1nxJeJfHt
The screenshot only displays the shortened form Xtog...JfHt. The visible parts are consistent with the reference address, but a full character-by-character match still needs to be checked.
Follow these steps:
- Copy the complete address from the token page.
- Confirm that the network is Solana, rather than another network with a similar ticker.
- Compare every character with the reference address.
- Check an explorer for token information and transactions.
- Distinguish the token address from the address of the pool where trading takes place.
If the address differs, do not apply this article's price analysis to that token. Matching names and logos do not prove that they are the same asset.
Read also: What Is NeoSoul (DNA)? Token Utility and Tokenomics
XTO Risks to Consider
1. Liquidity Is Smaller Than Valuation
In the screenshot, liquidity of US$272.3 thousand is approximately 2.33% of the US$11.7 million FDV. This comparison provides context on market size, rather than a threshold for declaring the token safe or dangerous.
The size of a transaction that can be executed still depends on the pool's structure and active liquidity. Do not assume all displayed liquidity is available to absorb sales at the last traded price.
2. Trading Activity Does Not Establish the Number of Buyers
The 24-hour volume of US$139.2 thousand represents the value of trading activity, rather than entirely new funds flowing in. The same wallet can make several transactions during that period.
An increase in volume therefore needs to be considered alongside the number of participants, transaction direction, and changes in liquidity. High volume alone does not prove sustained demand.
3. Price History Is Still Limited
A short chart provides fewer opportunities to observe price responses under different market conditions. Visible technical zones can change quickly when large transactions occur.
Use price levels as evaluation points. Avoid assuming that a pattern formed by a few candlesticks is enough to establish the next direction.
4. Transparency and Operator Control
Check who has the authority to change important settings and how changes are announced. Clear documentation helps distinguish automated rules from processes that still depend on operators.
If authority or terms cannot yet be understood, record that as an uncertainty. Do not fill information gaps with positive assumptions.
Read also: What Is American Dividend Protocol (ADP)? Understanding the Token and Its Risks
What Should You Monitor Next?
Watch whether candlestick closes hold above the nearest zone, supported by volume and liquidity. Also evaluate changes in holder distribution and the transparency of project information.
For rewards, compare observation periods of equal length. One day of high payments should not be used to estimate monthly income without considering variations in activity.
Record the time of each check and the source of every figure. This habit helps you distinguish actual developments from old data circulating again.
Conclusion
Understanding what XTO coin is requires more than looking at the US$0.0117 price in the screenshot. Market data provides a picture of trading activity, while assessing the project requires verifying its contract, mechanism, and evidence of implementation.
Use the figures in this article as a snapshot and historical context. If you want to continue exploring crypto, you can sign up for Bittime and check the services available for your needs.

Bittime is a Digital Financial Asset Trader (PAKD) platform licensed and supervised by the Financial Services Authority (OJK), where you can buy Bitcoin in Indonesia and hundreds of other cryptocurrencies starting from IDR 10,000. Registration is quick and secure, and you can get started today.
Track the USDT to IDR conversion rate and your favorite cryptocurrencies' price movements in real time. Everything is available in one crypto investment app that you can download for free from the Play Store.
Ready to get started? Sign up for Bittime now and put your investment strategy into action on a platform trusted by millions of users in Indonesia.
FAQ
What is XTO coin?
XTO is the XTruth Oil token on Solana, which promotes USOon rewards. Its rights and benefits need to be checked through the project's terms.
What is XTO's price in the screenshot?
The top summary displays US$0.0117, while the displayed candlestick close is US$0.01101. These figures are a snapshot, rather than a directly checked real-time price.
Is XTO coin legit?
The available data is insufficient for a comprehensive assessment. Payment evidence and trading displays need to be supplemented with checks on transparency and system control.
Does a “Normal” security label mean XTO is safe?
That conclusion cannot be drawn because the scope of the scan is not visible. The label does not guarantee profits or eliminate transaction risks.
What should you check before using an XTO chart?
Confirm the complete token address and the correct network. Then check the timeframe and when the data was captured so the analysis does not use the wrong context.
Disclaimer: The views expressed belong exclusively to the author and do not reflect the views of this platform. This platform and its affiliates disclaim any responsibility for the accuracy or suitability of the information provided. It is for informational purposes only and not intended as financial or investment advice.

.png)