NeoSoul (DNA) Price Prediction: Upside Potential and Risks
2026-10-19
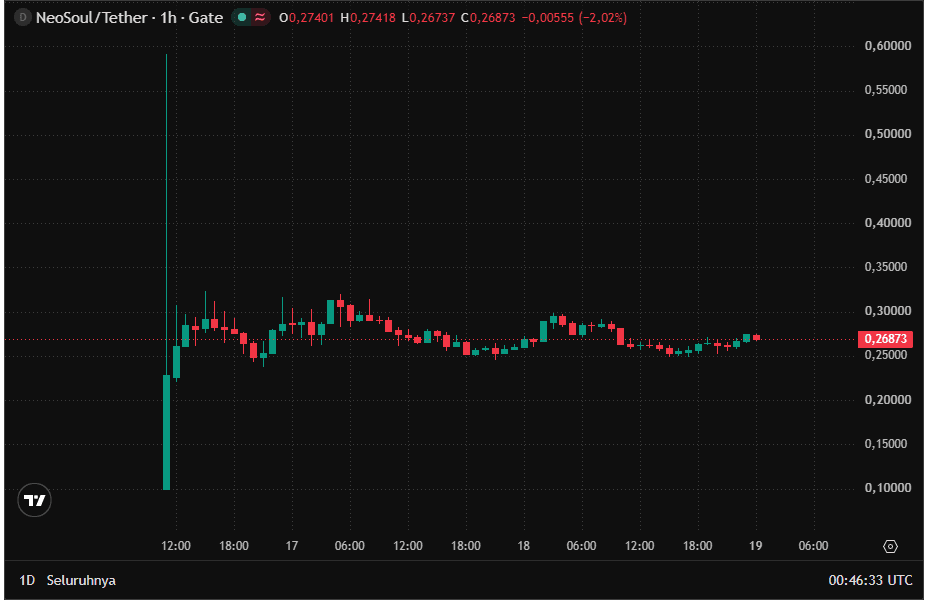
The NeoSoul price prediction points to a consolidation phase following a very sharp initial move. On the one-hour chart analyzed, DNA is trading at around 0.26873 USDT, with potential support at 0.25–0.26 and resistance at 0.29–0.30 USDT. Further upside depends on whether the price can break out of this range and sustain the breakout.
The market snapshot records a price of US$0.2679, down 1.5% over 24 hours. To assess whether this creates an opportunity for recovery or precedes a correction, you need to examine price structure, trading activity, and token supply together.
Key Takeaways
- NeoSoul is trading sideways after its initial volatility, leaving the next trend direction unconfirmed.
- The 0.25–0.26 USDT and 0.29–0.30 USDT areas are the key zones to watch for price reactions.
- Differences in supply data and a limited trading history should be considered before setting long-term targets.
NeoSoul Price Today: Market Snapshot and Conditions
This analysis was prepared on October 19, 2026, using the images provided. The chart displays 00:46:33 UTC, or 07:46:33 Western Indonesian Time (WIB), but the full capture date is not shown in the image.
The market snapshot contains the following data:
- DNA price: US$0.2679.
- 24-hour change: down 1.5%.
- 24-hour range: US$0.2544–US$0.2944.
- Market capitalization: approximately US$34.751 million.
- 24-hour trading volume: approximately US$90.525 million.
- Fully diluted valuation (FDV): approximately US$267.318 million.
- Circulating supply: 130 million DNA.
- Total and maximum supply: 1 billion DNA.
Prices in the aggregated snapshot and the exchange chart differ slightly. The technical analysis below uses the DNA/USDT pair, while the market statistics use the snapshot denominated in US dollars.
These figures do not need to be reconciled into a single price. Aggregated prices and prices on an individual exchange can differ because of their transaction sources and update times.
Read also: 1WIN Token Price Prediction After Listing: Potential and Risks
What Are NeoSoul and the DNA Token?
NeoSoul is a project developing economic infrastructure for AI agents. The project description includes NeoTrade for executing trading activities and EvoEvo for developing agent capabilities.
DNA is the token associated with this ecosystem. However, product growth does not automatically lead to an increase in the token's price.
To assess the outlook for NeoSoul DNA, you need to examine the relationship between product usage and demand for the token. Technological claims alone are not enough to demonstrate sustained market demand.
NeoSoul Price Analysis Based on the One-Hour Chart
Price structure: consolidation after initial volatility
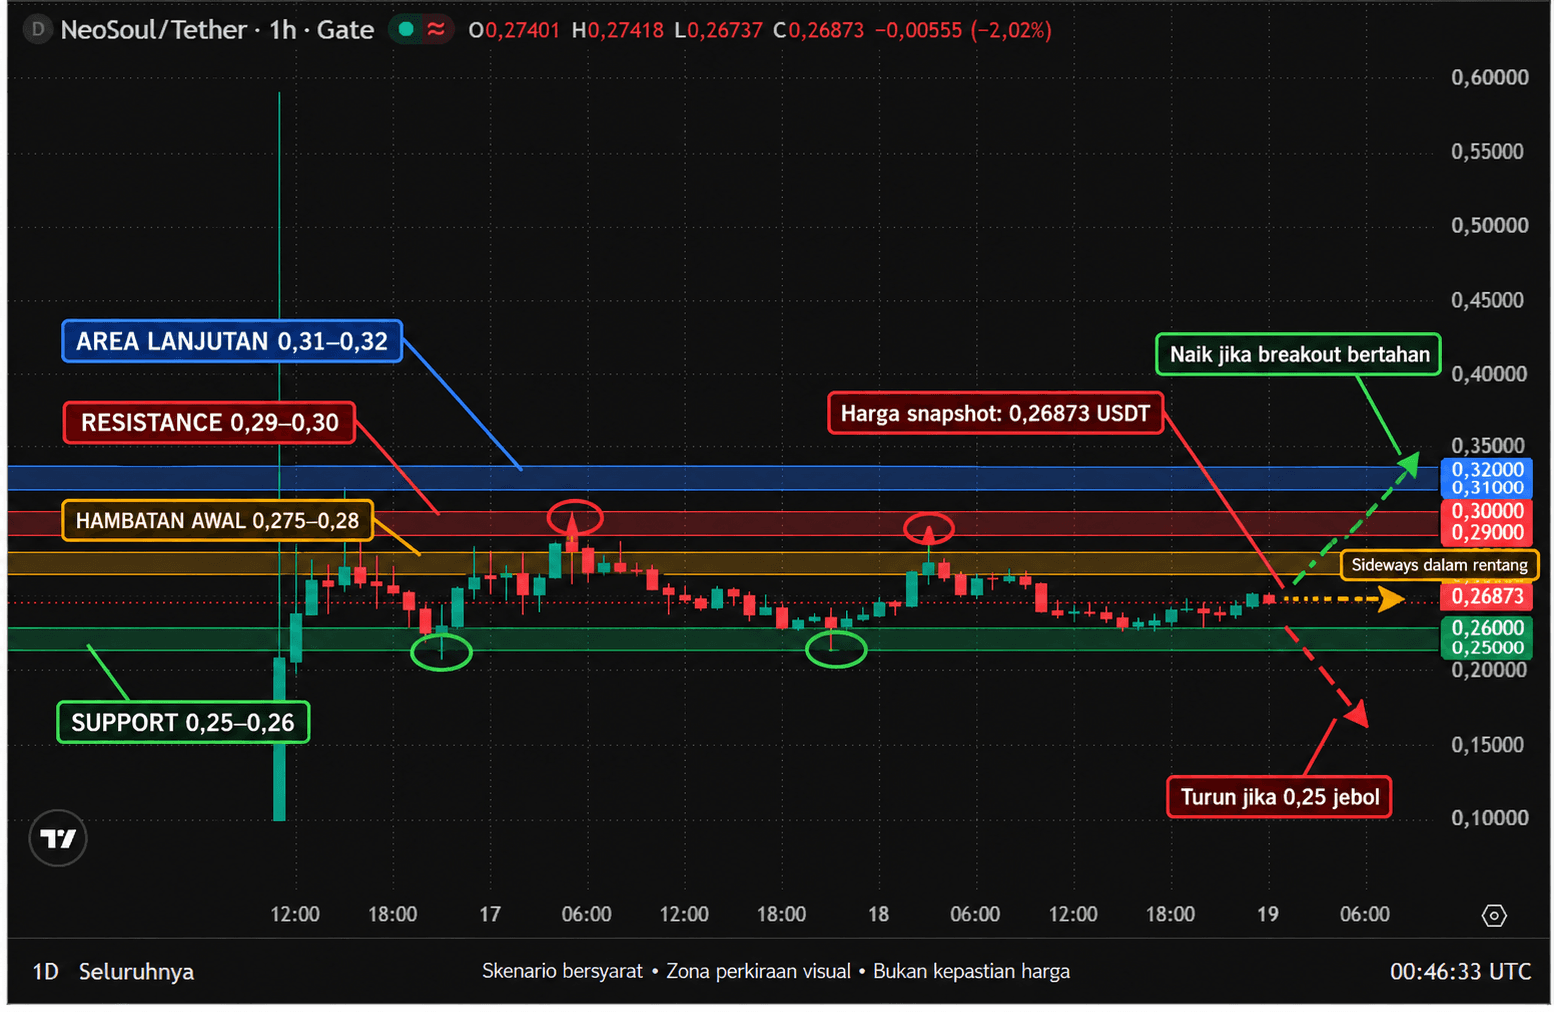
The chart shows an extreme spike at the start of trading, followed by price action largely within the 0.25–0.31 USDT range. Several subsequent attempts to rise stalled, and the price moved back toward the lower end of the range.
On the right side of the chart, a modest recovery toward 0.26873 USDT is visible. However, this move is not enough to conclude that a new uptrend has formed.
The early candle wick approaching 0.59 USDT is not used as a primary target. A single extreme trade during the initial phase does not establish that the market can accept that price again.
Potential support: 0.25–0.26 USDT
The 0.25–0.26 USDT area lies close to several bounce points on the chart. This makes it a zone worth monitoring as potential short-term support.
Stronger confirmation requires subsequent price reactions, such as a rejection of lower prices and a candle close back above the zone. Conversely, repeated closes below 0.25 would weaken the consolidation structure.
If this zone fails to hold, the available image does not provide a strong basis for identifying the next support level precisely. Avoid adding downside targets based solely on round numbers.
Initial resistance: 0.275–0.28 USDT
Before testing the upper end of the range, DNA needs to clear the area around 0.275–0.28 USDT. This zone is close to several previous price moves and may act as an initial barrier to recovery.
If the price reaches this area but quickly falls back, the latest rise may still be a temporary bounce. Holding above a level after a breakout is more meaningful than a single candle wick extending beyond it.
Key resistance: 0.29–0.30 USDT
Several local highs are visible around 0.29–0.30 USDT. This is an important resistance area because previous advances have stalled near it several times.
If DNA can break above this area and hold, the zone around 0.31–0.32 USDT becomes the next area to watch. This is a visual estimate from the chart, not a guaranteed target.
The chart does not display volume, RSI, or MACD indicators. Therefore, this analysis makes no claims about overbought conditions, divergence, or breakout strength based on those indicators.
Read also: Can American Rewards Fund (ARF) Reach US$1?
Four Factors Affecting NeoSoul DNA's Price
1. Trading activity and market depth
Trading volume in the snapshot is approximately 2.6 times the market capitalization. This ratio indicates substantial trading value relative to the valuation of circulating tokens, but it does not automatically demonstrate net buying.
A single token can change hands many times in a day. To assess how easily trades can be executed, also check the spread, order book depth, and potential slippage on the exchange you use.
2. Circulating supply and potential dilution
The snapshot shows 130 million DNA in circulation out of a maximum of 1 billion tokens, or approximately 13%. This means most of the maximum supply is not included in that circulating supply figure.
Potential supply increases need to be weighed against demand growth. However, the maximum supply figure does not indicate when additional tokens will enter the market.
A verified unlock schedule is needed before drawing conclusions about supply pressure on a specific date. Unlocked tokens are also not always sold immediately by their holders.
3. Product adoption and token demand
Developments in NeoTrade or EvoEvo are relevant to DNA's valuation only if they create a clear economic connection to the token. This connection needs to be demonstrated through documented usage mechanisms, not merely assumed.
Useful metrics include active users, product activity, and evidence of demand for the token. Without this data, long-term assessments will depend more heavily on expectations.
4. Market sentiment and airdrop distribution
Changes in interest in altcoins can affect demand for DNA. However, movements in Bitcoin or the AI sector alone cannot explain every change in its price.
Searches for “DNA Airdrop” also need to be distinguished from investment analysis. Airdrop distributions can increase the number of tokens available for trading, but their impact depends on the amount, distribution timing, and recipients' decisions.
The two images provide no basis for claiming that airdrop selling caused the decline shown in the snapshot. Establishing that causal relationship requires additional data.
Read also: Artificial Inu (AI) Price Prediction: Can It Break Above US$1?
NeoSoul Price Prediction: Three Short-Term Scenarios
The following scenarios use the one-hour chart to monitor the next few trading sessions to several days. The analysis needs to be updated when the price leaves the range or material new information emerges.
Bullish scenario
The recovery scenario strengthens if DNA can clear 0.275–0.28 USDT and hold that area on a retest. The next step would be to test resistance at 0.29–0.30 USDT.
If the second breakout holds, the 0.31–0.32 USDT area could become the next zone to evaluate. This scenario weakens if the price quickly falls back below the breakout area.
Sideways scenario
Consolidation continues if the price remains capped below 0.29–0.30 USDT while buyers continue to defend 0.25–0.26 USDT. In this situation, movements in the middle of the range do not provide a clear direction.
The main risk is treating every bounce as the start of an uptrend. Wait for a more convincing structural change before updating the outlook.
Bearish scenario
The bearish scenario becomes more relevant if a candle closes below 0.25 USDT and the price fails to reclaim that zone. This pattern indicates that the previous bounce area is no longer holding.
No precise downside target is set based on this image. Additional data is needed to identify the next trading area and avoid unfounded estimates.
Read also: ALTAI Price Prediction: Can Altai the Tiger Break Above US$0.1?
What to Check Before Making a Decision
Start by defining your analysis horizon. A one-hour chart is useful for assessing short-term changes, but it is insufficient for projecting prices through the end of 2026 or several years ahead.
Next, check whether the candles being analyzed have closed. The price of an active candle can change, so a breakout signal may not hold at the close.
Finally, set your risk limits and understand trading costs. Differences in execution prices can be significant when markets move quickly or order book depth is limited.
Conclusion
The current NeoSoul price prediction is best viewed as a set of scenarios during a consolidation phase. The 0.25–0.26 USDT area serves as potential support, while 0.29–0.30 USDT is the main hurdle to clear before assessing further upside potential.
You can sign up for Bittime if you want to start exploring crypto trading services, then review the available assets and their risks. This analysis neither guarantees an outcome nor confirms that DNA is available on the platform.

Bittime is a Digital Financial Asset Trader (PAKD) platform licensed and supervised by Indonesia's Financial Services Authority (OJK), where you can buy Bitcoin in Indonesia and hundreds of other crypto assets starting from IDR 10,000. Registration is fast and secure, and you can get started today.
Track the USDT to IDR exchange rate and the price movements of your favorite crypto assets in real time. Everything is available in one crypto investment app that you can download for free from the Play Store.
Ready to get started? Sign up for Bittime now and put your investment strategy into action on a platform already trusted by millions of users in Indonesia.
FAQ
What is NeoSoul (DNA)?
NeoSoul develops infrastructure for AI agents, including products related to trading activities. DNA is the token associated with its ecosystem, but its prospects still need to be assessed through evidence of usage and demand.
What is NeoSoul's price today?
The snapshot used in this article shows US$0.2679, while the DNA/USDT chart displays 0.26873 USDT. Both are prices recorded when the images were captured and may differ from the price when you read this article.
Will NeoSoul DNA's price rise?
The prospects for recovery strengthen if the price clears the initial barrier and sustains a breakout above resistance. Until that confirmation appears, an advance may still be part of sideways price action.
Why does token supply matter in NeoSoul price predictions?
An increase in circulating supply can change the balance between supply and demand. Its impact depends on the number of tokens entering the market, distribution timing, and demand's ability to absorb them.
Can the DNA airdrop cause the price to fall?
Selling by airdrop recipients can add selling pressure, but this does not happen automatically. Distribution and trading activity data are needed to link an airdrop to a particular decline.
Disclaimer: The views expressed belong exclusively to the author and do not reflect the views of this platform. This platform and its affiliates disclaim any responsibility for the accuracy or suitability of the information provided. It is for informational purposes only and not intended as financial or investment advice.

.png)