CATONICE Price Prediction: Can it Break US$0.1?
2026-10-19
A CATONICE price of US$0.1 remains a speculative scenario. From the reference price of US$0.001079 on the chart analyzed, the token would need to reach approximately 92.68 times its reference price, equivalent to an increase of about 9,167.84%. This calculation shows the size of the required price change, not the likelihood of achieving it.
The chart shows an initial surge followed by a correction, while the trading history remains very short. Therefore, assessing the target requires considering price structure, supply, and liquidity—not just the percentage increase shown in market statistics.
Key Takeaways
- CATONICE needs to rise approximately 9,167.84% from US$0.001079 to reach US$0.1.
- Assuming the supply at the time of review remains unchanged, this target implies a valuation of approximately US$99.23 million.
- The daily chart still contains very few candles, so the following price levels are preliminary areas to monitor, not strong support and resistance levels.
What Is CATONICE?
CATONICE, also known as catonthinice, is a meme coin on the Solana network. Its visual identity features a cat skateboarding on ice.
The project website states that the token was created for entertainment, without claims of intrinsic value or promises of financial returns. This statement should be considered before associating the token with any specific investment benefits.
This article discusses the token with the following address:
6yMZv1NgnQWBeocyfCNKmdqGr3Enu3Lrdpz3TJRvpump
This address serves as a reference for matching market information. A name or logo alone is not sufficient, as different assets may use similar identities.
Read also: NeoSoul (DNA) Price Prediction: Upside Potential and Risks
CATONICE Price Today and Market Conditions
This analysis was prepared on October 19, 2026, using the images provided. The chart shows the time 09:56:19 UTC+7, while the statistics image does not show when it was captured.
The statistical snapshot shows:
- Price: US$0.001063.
- Liquidity: approximately US$95,000.
- FDV: approximately US$1 million.
- Displayed market capitalization: approximately US$1 million.
- Volume in the 24-hour panel: approximately US$3.2 million.
- 24-hour change: up approximately 1,613%.
- Trading pair age: approximately 11 hours.
Because the pair is only about 11 hours old, the figures in the 24-hour panel do not represent a full day of trading. A large percentage increase should also be considered alongside the starting price used for comparison.
The chart price of US$0.001079 is used for all calculations toward the target. The figures in the statistical snapshot describe trading conditions and are not used as a different starting point for the calculations.
A Higher Number of Buy Transactions Does Not Mean Buy-Value Dominance
The statistics image records 68,946 buy transactions and 18,719 sell transactions. However, the values of both buy and sell transactions are rounded to approximately US$1.6 million.
This means that a higher number of buy transactions does not prove that buy value dominates. Transaction sizes vary, and a single wallet may transact repeatedly.
Read also: 1WIN Token Price Prediction After Listing: Potential and Risks
How Much Must CATONICE Rise to Reach US$0.1?
The calculation uses a reference price of US$0.001079 and a hypothetical target of US$0.1.
Price multiple:
US$0.1 ÷ US$0.001079 = 92.68 times.
Percentage increase:
((US$0.1 ÷ US$0.001079) − 1) × 100% = 9,167.84%.
The distinction between these two figures matters. A price reaching 92.68 times its initial value means an increase of approximately 91.68 times the initial value, before transaction fees.
This calculation does not indicate when the target might be reached or how likely it is. The available data provides no basis for assigning a date or probability.
The US$0.1 target is also not derived from a technical pattern on the chart. It is a scenario being examined, so it should not be described as a confirmed breakout target.
Read also: Can American Rewards Fund (ARF) Reach US$1?
What Would CATONICE’s Valuation Be at US$0.1?
Data blockchain reviewed shows current supply approximately 992,334,521.34 CATONICE. If this amount remains unchanged, the calculation is:
US$0.1 × 992,334,521.34 tokens = approximately US$99.23 million.
This figure is a valuation based on the current supply, not a confirmed market capitalization based on independently verified circulating supply. If the supply changes, the calculation will change as well.
For comparison, the statistics image shows a rounded valuation of approximately US$1 million. This rounded figure is not used to calculate the price multiple precisely.
An increase in valuation to US$99.23 million does not mean the market must receive new funds equal to the nominal difference. Market capitalization is calculated from price and supply, while price is formed through transactions and liquidity conditions.
This valuation also does not guarantee that all holders can sell at US$0.1. Large sell orders can affect execution prices.
Read also: Artificial Inu (AI) Price Prediction: Can It Reach US$1?
CATONICE Chart Analysis: Levels to Watch
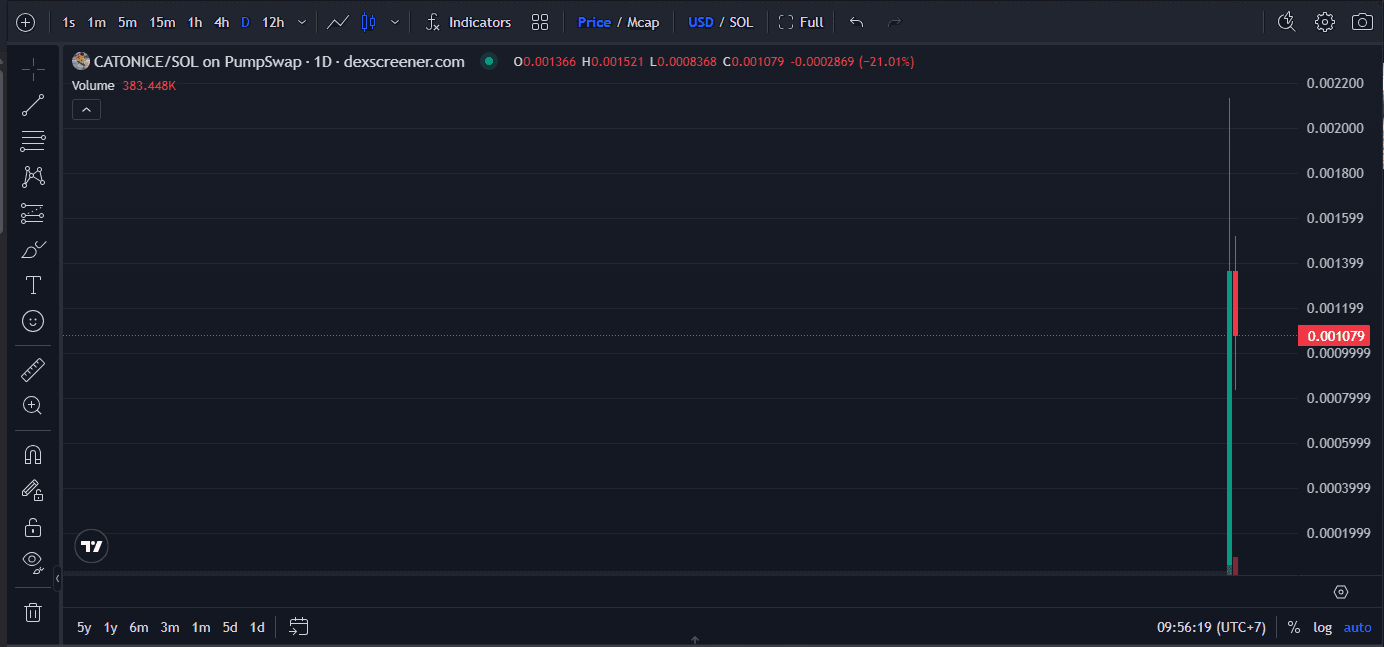
The chart uses the daily (1D) timeframe, with prices shown in US dollars for the CATONICE/SOL pair. The image shows only about two candles, which is insufficient to draw a strong conclusion about the trend.
The displayed candle has an opening price of US$0.001366, a high of US$0.001521, a low of US$0.0008368, and a last price of US$0.001079. The decline of approximately 21.01% in the header refers to that candle, not the 24-hour change shown in the statistics panel.
It is also unclear whether the latest candle has finished forming. Therefore, the following interpretation is preliminary.
Lower range: US$0.00084–US$0.00100
US$0.0008368 is the lowest point of the visible candle. Meanwhile, US$0.00100 is a psychological price level close to the reference price.
Both can be monitored as potential price-reaction areas. However, a single low is not enough to call this zone a support level that has been tested repeatedly.
If the price falls below US$0.0008368 and does not recover quickly, short-term weakness becomes more relevant. This image does not provide enough evidence to set the next downside target precisely.
Recovery range: US$0.00137–US$0.00152
This zone refers to the opening and high of the latest candle. A return to this range would indicate a recovery from the price shown in the screenshot.
To assess whether the move can continue, watch whether the price holds after breaking through and retesting the level. A brief touch of a level is not enough to confirm an uptrend.
Initial peak: approximately US$0.0021
Based on visual inspection, the wick of the first candle reached approximately US$0.0021. This area is a local-peak reference, not a tested long-term resistance level.
The long upper wick shows that the price briefly moved higher before falling back. The chart alone does not reveal whether this was caused by large-holder selling, liquidity, or another factor.
Read also: ALTAI Price Prediction: Can Altai the Tiger Reach US$0.1?
CATONICE Price Prediction: Three Conditional Scenarios
The following scenarios are intended to monitor the next several sessions to few days. They should all be updated when more candles and trading data become available.
Recovery scenario
A recovery would become more convincing if the price moves back above US$0.00137–US$0.00152 and holds that range. After that, the initial peak around US$0.0021 becomes the next level to watch.
This scenario weakens if the breakout quickly reverses and the price falls again. Even a successful retest of the initial peak would not establish a path to US$0.1.
Consolidation scenario
The price may move sideways if trading remains between the lower and recovery ranges. This kind of movement allows time to see whether bounce and rejection points begin to form repeatedly.
There is not yet enough evidence to describe this consolidation as accumulation. That conclusion would require additional evidence about transaction activity and holder behavior.
Weakness scenario
Downside risk increases if the price loses the US$0.00084 area and fails to reclaim it. A simultaneous decline in liquidity could amplify the impact of sell transactions.
A new downside target should be determined using subsequent data. Choosing an arbitrary figure would imply a level of precision that the chart does not support.
Read also: STRK Price Rises: What Is Starknet’s 2027 Quantum-Resistant Target?
Risks That Could Prevent CATONICE from Reaching US$0.1
First, liquidity is relatively limited compared with trading activity. Volume of approximately US$3.2 million reflects the value traded during the observation period, while liquidity of around US$95,000 describes the pool’s condition in the snapshot.
These figures are not interchangeable. High volume does not guarantee that the next transaction can be executed without slippage.
Second, the price history is still short. Some early price movements can appear very large because the reference price is low and the market is still finding equilibrium.
Third, sustained demand has not been established. A meme’s appeal can attract attention, but it does not ensure that interest will last or develop into stable demand.
Fourth, ownership distribution has not been fully analyzed. Concentration risk should be assessed by distinguishing individual wallets, pools, and other accounts with specific functions.
Before making a decision, check the contract, liquidity conditions, and relevant transaction sizes. If you want to explore crypto trading services, you can sign up for Bittime and check the available assets without assuming that CATONICE is automatically listed.
Conclusion
For CATONICE to reach US$0.1, its price would need to rise approximately 9,167.84% from the chart price. Assuming the current supply remains unchanged, this target implies a valuation of around US$99.23 million.
The calculation is straightforward, but the likelihood of reaching the target cannot yet be determined. The near-term focus is on the price’s ability to recover, the formation of a clearer structure, and liquidity resilience.

Bittime is a licensed Digital Financial Asset Trader (PAKD) platform supervised by the Financial Services Authority (OJK)— where you can buy Bitcoin in Indonesia and hundreds of other crypto assets starting from IDR 10,000. Registration is quick and secure, and you can get started today.
Track the USDT-to-IDR conversion and the real-time price movements of your favorite crypto assets. It is all available in one crypto investment app that you can download for free from the Play Store.
Ready to get started? Sign up for Bittime now and execute your investment strategy on a platform trusted by millions of users in Indonesia.
FAQ
Can CATONICE reach US$0.1?
That target can be calculated as a scenario, but there is not enough evidence to assess it as an outcome likely to occur within a specific timeframe. The trading history is still short, and the distance from the reference price is substantial.
How many times must CATONICE rise to reach US$0.1?
From US$0.001079, the price would need to reach approximately 92.68 times the reference value. That is equivalent to an increase of about 9,167.84%.
What would CATONICE’s market capitalization be at US$0.1?
Using a current supply of approximately 992.33 million tokens, its valuation would be around US$99.23 million. Calling this market capitalization requires separate confirmation of the circulating supply.
Which CATONICE price levels should be monitored?
The lower range is around US$0.00084–US$0.00100, while the recovery range is around US$0.00137–US$0.00152. These levels are still preliminary because the chart contains very few candles.
What are the risks of buying CATONICE after a major price increase?
Risks include a sharp correction, slippage, changes in liquidity, and weakening demand. Previous percentage gains do not guarantee further price increases.
Disclaimer: The views expressed belong exclusively to the author and do not reflect the views of this platform. This platform and its affiliates disclaim any responsibility for the accuracy or suitability of the information provided. It is for informational purposes only and not intended as financial or investment advice.

.png)