Latest Bitcoin Price Prediction for March 19, 2026
2026-03-18
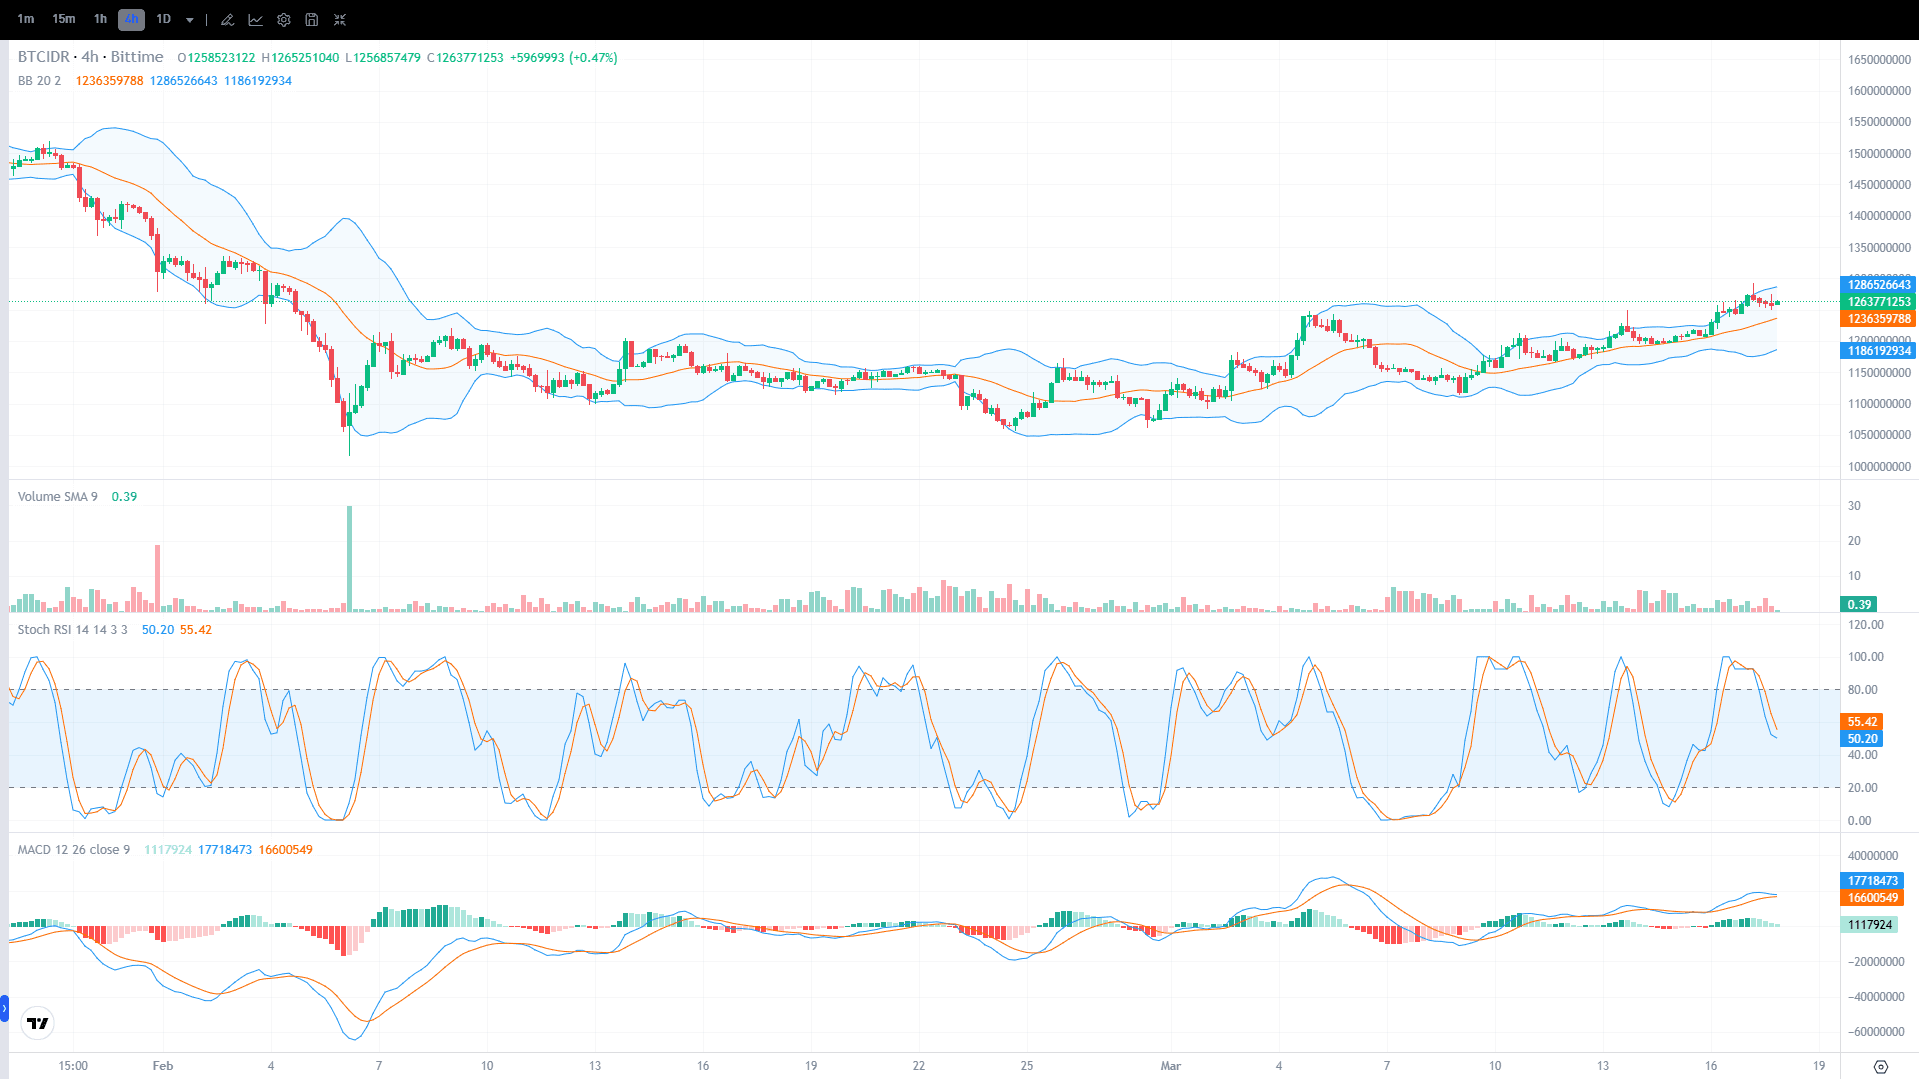
Bitcoin (BTC) has once again shown interesting price movements today, March 18, 2026. Based on the BTC/IDR 4-hour timeframe chart on Bittime, Bitcoin's price remains in a short-term uptrend, although it has begun entering a healthy consolidation phase after rallying over the past few days.
Daily price analysis is becoming increasingly important to identify short-term trend direction, especially as price approaches new resistance levels. With crypto market volatility still high, understanding support, resistance, Bollinger Bands, Stochastic RSI, and MACD is key to making more measured decisions.
In this article, we review Bitcoin's latest price performance, technical analysis, and price prediction for March 19, 2026 based on the latest market data and charts from Bittime as of March 18, 2026.
Key Takeaways
- Bitcoin is currently trading in the range of IDR 1.258 billion–1.265 billion and was last closed at around IDR 1,263,771,253.
- Nearest resistance is at IDR 1,265,251,040 – IDR 1,286,526,643, while key support is at IDR 1,236,359,788 and lower support around IDR 1,186,192,934.
- As long as the price stays above the Bollinger mid-band at IDR 1,236,359,788, the short-term trend remains positive. A breakdown could lead to correction toward IDR 1.220 billion – IDR 1.186 billion.
Track the latest Bitcoin price and start trading BTC/IDR easily through the Bittime platform now.
Bitcoin Price Performance Today
Here is a summary of BTC price movement based on the 4-hour BTC/IDR chart:
| Description | Estimated Value |
| Last Price | IDR 1,263,771,253 |
| Open | IDR 1,258,523,122 |
| High | IDR 1,265,251,040 |
| Low | IDR 1,256,857,479 |
| Change | +IDR 5,969,993 (+0.47%) |
| Volume | Stable with moderate increase |
Note: Prices may vary across exchanges due to differences in liquidity, spread, and order book depth.
Bitcoin Price History
In recent weeks, Bitcoin experienced significant downward pressure before forming a more stable recovery phase. On the 4-hour chart, price movement from late February to mid-March shows a gradual rebound that evolved into a short-term uptrend.
After previously trading in the IDR 1.10–1.15 billion range, BTC has gradually recovered and is now holding above the Bollinger mid-band. This indicates that buying interest remains relatively strong, although traders are becoming more selective near resistance levels.
Overall, the current price structure is healthier compared to the previous decline phase, as recent candles remain above the mid-average and have not shown major breakdown signals.
Bitcoin Price Analysis – March 18, 2026
Bitcoin is currently moving in a bullish consolidation pattern near the upper Bollinger Band. The latest closing price at IDR 1,263,771,253 remains above the Bollinger mid-line at IDR 1,236,359,788, indicating a positive short-term trend.
However, momentum is starting to cool. The Stochastic RSI (50.20 and 55.42) has declined from overbought levels, suggesting slower movement or a potential minor pullback before continuing upward.
Meanwhile, MACD remains in positive territory. The MACD line at 1,771,8473 is above the signal line at 1,660,0549, with a positive histogram around 111.7924, indicating the uptrend structure is still intact.
Key BTC/IDR Levels
Resistance: IDR 1,265,251,040 – IDR 1,286,526,643
Support: IDR 1,236,359,788 – IDR 1,186,192,934
Bitcoin Price Prediction – March 19, 2026
Bitcoin is expected to move within the range of IDR 1.236 billion – IDR 1.286 billion, with a neutral-to-bullish bias as long as price remains above the Bollinger mid-band.
If buying pressure increases and price breaks above IDR 1,265,251,040, BTC could test IDR 1.275 billion – IDR 1,286,526,643.
On the downside, profit-taking could push price toward IDR 1.245 billion – IDR 1.236 billion. A breakdown could lead to deeper correction toward IDR 1.220 billion – IDR 1.186 billion.
Factors Affecting Bitcoin Price
Bollinger Bands Position
Price staying above the mid-line indicates bullish dominance, but proximity to the upper band suggests possible consolidation.
Stochastic RSI
The decline indicates cooling momentum. Not bearish yet, but signals a pause may occur.
MACD Positive
MACD still in positive zone shows uptrend remains intact unless a bearish crossover occurs.
Potential Scenarios
Bullish Scenario
Break above IDR 1,265,251,040 opens targets at IDR 1.275 – 1.286 billion.
Sideways Scenario
BTC may move sideways in IDR 1.245 – 1.265 billion range.
Bearish Scenario
Drop below IDR 1,236,359,788 may lead to IDR 1.220 billion or lower.
Conclusion
Bitcoin still shows a positive short-term structure, although momentum is weakening slightly. The key levels to watch are IDR 1.265 billion (resistance) and IDR 1.236 billion (support).
FAQ
What indicators are visible?
Bollinger Bands, Stochastic RSI, and MACD.
Why is IDR 1.236 billion important?
It is the Bollinger mid-band acting as dynamic support.
Can Bitcoin rise again?
Yes, if it breaks above resistance.
Is bearish signal strong?
Not yet, only momentum cooling.
How to monitor BTC price?
Through crypto exchanges and charting platforms.
Disclaimer: This content is for educational purposes only and not financial advice.
Disclaimer: The views expressed belong exclusively to the author and do not reflect the views of this platform. This platform and its affiliates disclaim any responsibility for the accuracy or suitability of the information provided. It is for informational purposes only and not intended as financial or investment advice.

.png)