ADTF Price Prediction: Can It Reach US$0.1?
2026-10-06
ADTF price prediction has become interesting after American Dividend Trust Fund showed highly aggressive price action since it began trading. Based on the analyzed 4-hour chart, ADTF is trading around US$0.02581, with an FDV of approximately US$25.8 million, liquidity of US$467.7 thousand, and 24-hour volume of around US$457.3 thousand.
The biggest question is not only whether ADTF can rise, but how much it needs to increase to reach US$0.1. From US$0.02581, ADTF needs to rise by around 287.4%, or nearly 3.87 times, making this target aggressive and highly dependent on sustained momentum and liquidity.
Key Takeaways
- ADTF is around US$0.02581 based on the analyzed chart.
- The US$0.1 target requires an increase of around 287.4% from that level.
- Momentum appears very strong, but the chart's very short history keeps volatility and correction risks high.
What Is ADTF?
ADTF is the ticker used for American Dividend Trust Fund, which is traded on the Solana network.
Because ADTF is still in a very early trading phase, its historical data is not yet long enough to form strong long-term technical patterns.
This characteristic means the price can change quickly when buying or selling volume increases.
Why Is ADTF Attracting Attention?
One of the main reasons is the very rapid price movement since the token began actively trading.
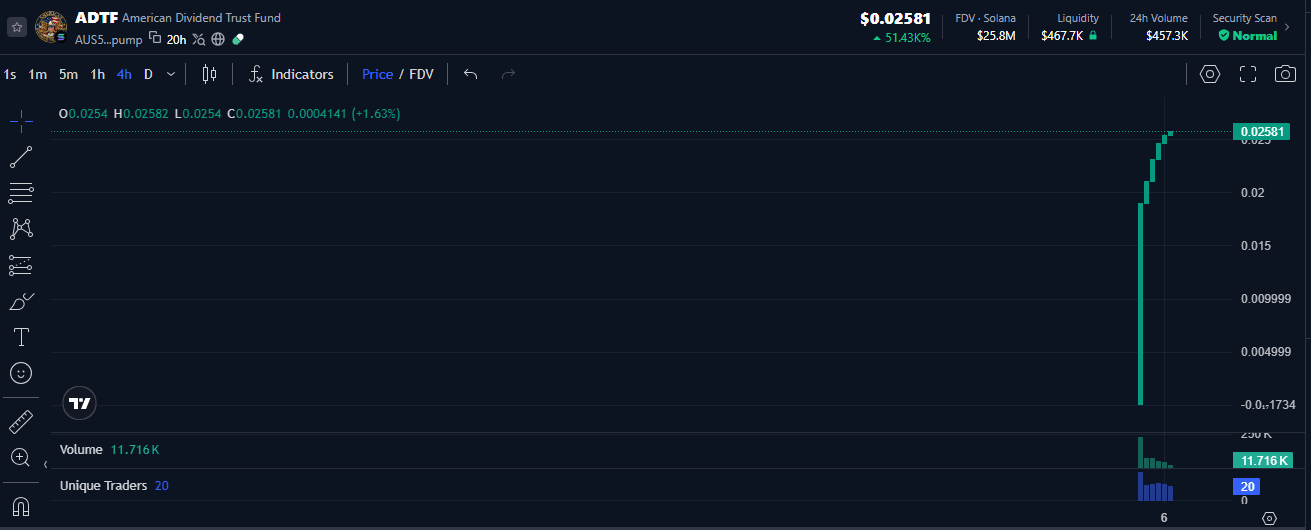
The 4-hour chart shows the price moving from a very low area before surging sharply to around US$0.02581.
However, a rapid rise does not automatically mean the trend will continue. New tokens can experience much higher volatility than crypto assets with greater liquidity and longer trading histories.
Read also: Can ATFS Reach US$0.01? American Trust Fund System Price Prediction
ADTF Price Today and Market Data
Based on the chart you provided, the key ADTF data points are:
- Price: US$0.02581
- FDV: approximately US$25.8 million
- Liquidity: approximately US$467.7 thousand
- 24-hour volume: approximately US$457.3 thousand
- Volume on the displayed candle: approximately US$11.716 thousand
- Unique traders shown: 20
- Security scan on the chart display: Normal
The data indicates fairly substantial trading activity compared with the available liquidity.
24-hour volume of around US$457.3 thousand is almost equal to liquidity of US$467.7 thousand. This ratio is worth noting because high transaction activity relative to relatively small liquidity can make the price more sensitive to large orders.
ADTF Price Analysis Based on the 4-Hour Chart
The provided chart uses a 4-hour timeframe. The visible structure is still very short because ADTF has formed only a few candles following the initial surge.
The first thing that stands out is the vertical upward movement. The price expanded from the lower area toward around US$0.018, then moved into the US$0.02 area and eventually reached around US$0.02581.
ADTF Momentum Remains Very Strong
Large green candles indicate dominant buying pressure during the early trading phase.
On the latest candle, the data shows:
- Open: US$0.02540
- High: US$0.02582
- Low: US$0.02540
- Close: US$0.02581
- Candle change: approximately +1.63%
The candle shows that the price is still holding very close to the candle high. This indicates that buyers are still able to keep the price near the highest level visible on the chart.
However, this condition is not enough to conclude that a further breakout will definitely occur.
Read also: USDF Price Prediction: Can It Reach US$1? Here's the Analysis
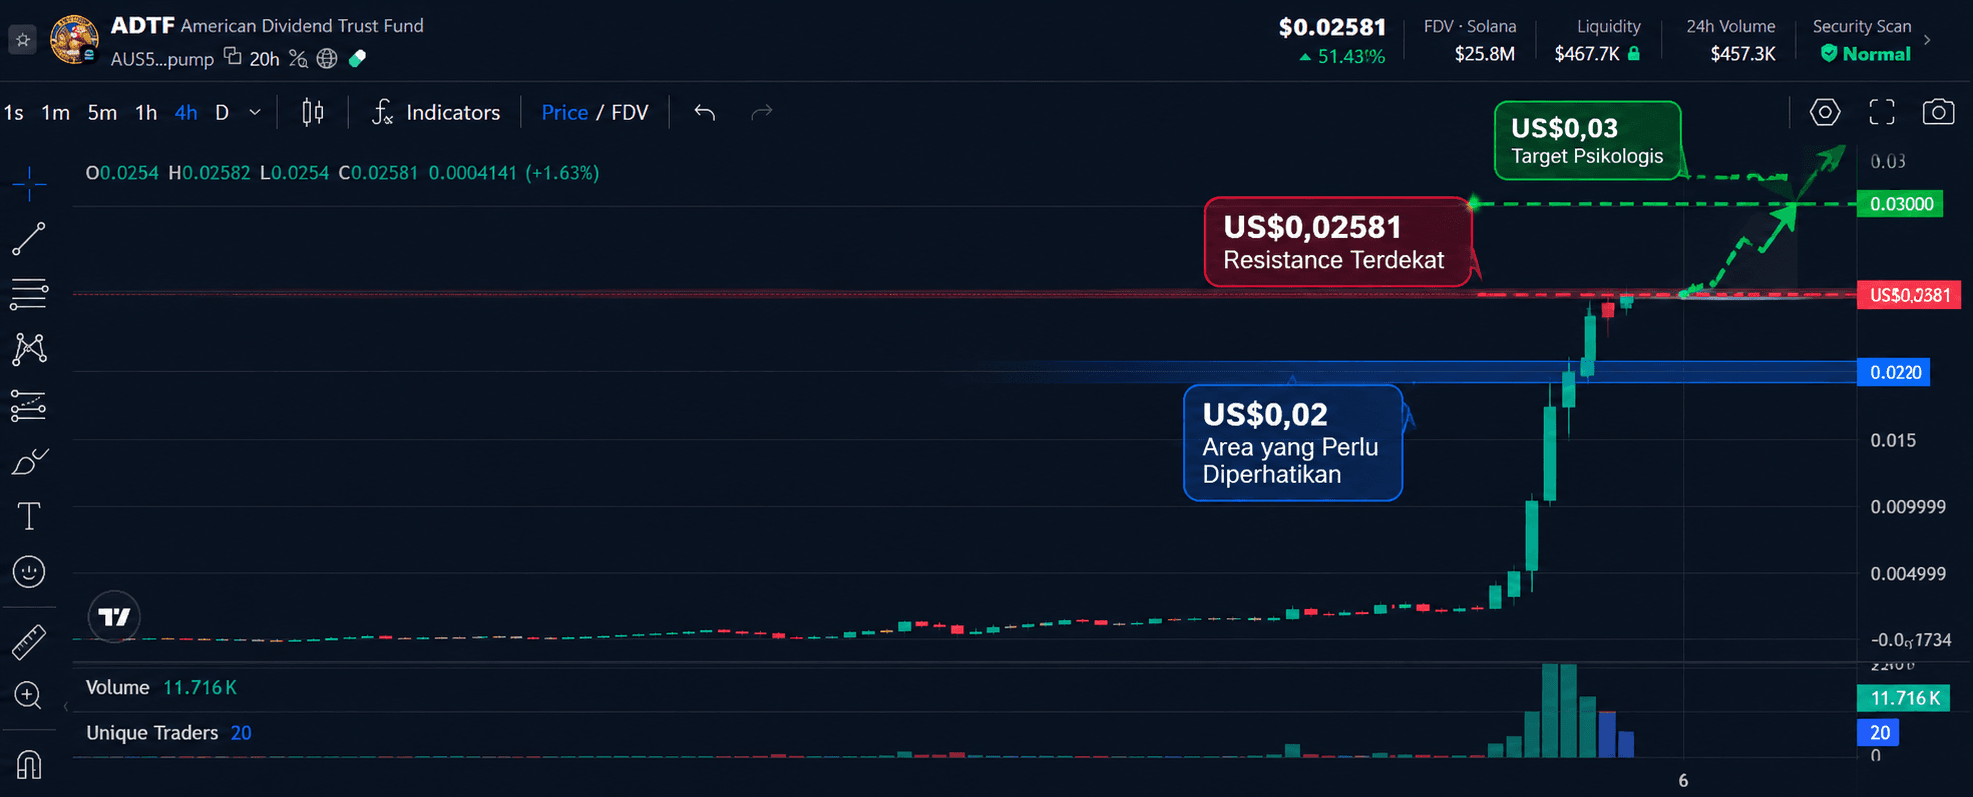
The US$0.02 Area Needs Attention
The US$0.02 area could become an important psychological level because the price previously moved through this area before reaching US$0.02581.
However, this level cannot yet be called strong support because the candle formation history is still very limited.
If ADTF corrects but remains above the US$0.02 area, the very short-term bullish structure still has a chance to hold.
Conversely, a sharp decline through that area would signal that the initial momentum is beginning to weaken.
US$0.02581 Becomes the Nearest Resistance
US$0.02581 is the highest level visible in the chart screenshot.
Because the price is currently near this level, the market needs fresh volume to produce a more convincing breakout.
If the price successfully breaks above that high and forms a new candle above it, attention could then shift to the psychological US$0.03 level.
However, US$0.03 is not a confirmed historical resistance level. It can only be used as a psychological area for assessing potential subsequent movements.
Can ADTF Reach US$0.1?
Now to the main question: can ADTF reach US$0.1?
Mathematically, that target is possible. However, ADTF needs a very large increase from the current chart price.
Price used:
US$0.02581
Target:
US$0.10
Calculation:
US$0.10 ÷ US$0.02581 = approximately 3.87x
This means ADTF must rise approximately 3.87 times from the US$0.02581 level.
In percentage terms, the required increase is approximately:
287.4%
Therefore, the US$0.1 target is not simply a small increase. ADTF needs to gain nearly another 300% from the price on the chart.
Read also: JASMY Rises 15%, Here Is the Price Analysis and Selling Pressure
What About ADTF's FDV at US$0.1?
The chart shows ADTF's FDV at around US$25.8 million when the price is US$0.02581.
If the supply underlying the FDV remains the same, the FDV would theoretically move proportionally with the price.
Thus:
US$25.8 million × 3.87 = approximately US$100 million
This means that for ADTF to reach US$0.1, its FDV would mathematically be around US$100 million, assuming the supply does not change.
This does not mean ADTF will definitely have that FDV. This figure only shows the valuation scale required if the price rises from US$0.02581 to US$0.1.
5 Factors That Could Drive ADTF Toward US$0.1
1. Continued Buying Momentum
Momentum is the most important factor in an early phase like this.
If buying volume continues to increase and the price is able to break to new highs, the short-term trend can remain bullish.
2. Increasing Trading Volume
24-hour volume of around US$457.3 thousand indicates fairly substantial trading activity relative to liquidity of around US$467.7 thousand.
Volume growth accompanied by a price increase is more attractive than a price increase that occurs while volume continues to decline.
3. Increasing Liquidity
Liquidity of around US$467.7 thousand is still far smaller than the FDV valuation of around US$25.8 million.
If liquidity increases along with growing market interest, trading can become more efficient and the risk of price impact can decrease.
4. Breakout to a New High
The price needs to consistently demonstrate the ability to move above previous highs.
A breakout accompanied by higher volume would be a stronger signal than a brief wick without follow-through.
5. Narrative and Adoption
The growth of a new token is not influenced by the chart alone.
Community development, utility, project transparency, token distribution, and ecosystem growth can affect market interest over the longer term.
Read also: MARSCOIN Price: How Far Can It Go Toward US$1?
3 Biggest Risks on the Way to US$0.1
1. Correction After the Surge
The chart shows a very rapid increase.
After a vertical move, profit-taking can cause a sharp correction even when the overall trend remains bullish.
2. Liquidity Is Out of Balance With Valuation
An FDV of around US$25.8 million compared with liquidity of around US$467.7 thousand shows a large difference in scale.
In such conditions, large orders can have a significant impact on the price.
3. Very Short Price History
This is one of the most important risks.
Because the chart has only a small amount of history, there is not yet enough data to confirm support, resistance, price patterns, or long-term trends with a high degree of confidence.
Therefore, ADTF price predictions should be treated as scenario analysis, not certainty.
Read also: SI Coin Price Prediction: Can Super Intelligence Reach US$0.01?
ADTF Price Scenarios
Bullish Scenario
A bullish scenario occurs if ADTF can maintain momentum, break above the high around US$0.02581, and then form a higher high with volume support.
In this condition, the US$0.03 psychological area could be the next point of attention.
If momentum remains strong and liquidity increases, higher targets could open up. However, to reach US$0.1, ADTF would still need to rise around 287.4% from the US$0.02581 price.
Neutral Scenario
In a neutral scenario, ADTF fails to continue the breakout but does not experience a major decline.
The price could enter a consolidation phase after the initial rise.
This condition could actually help form a more valid new support level because the market has more time to test a particular price level.
Bearish Scenario
A bearish scenario occurs if selling pressure increases and the price loses an important psychological area such as US$0.02.
If buying volume declines while sellers dominate, the price could experience a deeper correction.
In such a situation, the US$0.1 target becomes increasingly distant because ADTF must first rebuild bullish momentum.
Read also: UDR Coin Price Prediction: Can United Dividend Reserve Reach US$0.01?
What Should Be Monitored Before ADTF Moves Toward US$0.1?
If you are following ADTF's movement, don't look at the price alone.
Monitor the following five indicators:
- Price and candle structure
Watch whether ADTF forms a higher high and a higher low. - Volume
A breakout with higher volume is more convincing than a rise on thin volume. - Liquidity
Watch whether liquidity is increasing or instead decreasing. - FDV and supply
A price increase also means a higher valuation if the supply remains unchanged. - Trader activity
Growth in the number of traders can help indicate whether market interest is broadening.
Monitor ADTF and Other Crypto Assets on Bittime
Assets such as ADTF can change rapidly as volume, liquidity, and market sentiment change. If you want to follow the latest price updates, crypto news, and market analysis, you can use Bittime to monitor market developments regularly.
Can ADTF Rise to US$0.1?
The answer is yes mathematically, but the target is still very aggressive.
From US$0.02581, ADTF needs to rise around 287.4% to reach US$0.1. With an FDV of around US$25.8 million at that price, its fully diluted valuation would need to be around US$100 million if the supply remains unchanged.
The challenge is not simply reaching US$0.1. The main challenge is maintaining sufficient demand and liquidity for the nearly 3.87-fold increase to occur without being followed by significant selling pressure.
Conclusion
ADTF price predictions show that the US$0.1 target still requires a fairly long journey. Based on the analyzed chart, ADTF is around US$0.02581, requiring an increase of around 287.4%, or 3.87 times, to reach that target.
Initial momentum looks very strong, but the 4-hour chart is still too short to confirm a long-term trend. Liquidity of around US$467.7 thousand and 24-hour volume of around US$457.3 thousand also indicate that trading activity needs to be monitored continuously.
Therefore, ADTF reaching US$0.1 is not mathematically impossible, but it is an aggressive scenario requiring significant growth in demand, volume, liquidity, and valuation. If you want to follow ADTF's price development and other crypto assets, you can monitor the latest market data before making a decision.

Bittime is a licensed Digital Financial Asset Trader (PAKD) platform authorized and supervised by the Financial Services Authority (OJK) — where you can buy Bitcoin in Indonesia and hundreds of other crypto assets starting from IDR 10,000. Registration is fast, secure, and can be started today.
Monitor USDT to IDR conversion and the price movements of your favorite crypto assets in real time. Everything is available in one crypto investment app that can be downloaded for free from the Play Store.
Ready to get started? Sign up now on Bittime and execute your investment strategy with a platform trusted by millions of users in Indonesia.
FAQ
Can ADTF reach US$0.1?
Mathematically, ADTF can reach US$0.1 if there is a sufficiently large increase in demand and valuation. From US$0.02581, ADTF needs to rise around 287.4%, or 3.87 times.
What is ADTF's current price?
Based on the analyzed chart, ADTF is trading around US$0.02581. This figure is a snapshot and can change very quickly because ADTF still has a short trading history.
What is the ADTF price prediction?
There is no definite figure that can be stated as the ADTF price prediction. In a bullish scenario, the ability to maintain momentum and make new highs is an important factor before higher targets can be considered.
What affects the price of ADTF?
ADTF's price can be affected by trading volume, liquidity, market demand, token distribution, community activity, project development, and sentiment toward the asset.
What is the ADTF price target to reach US$0.1?
The target is US$0.1. From the US$0.02581 price on the chart, ADTF needs to rise approximately 3.87 times, or 287.4%, to reach that level.
Disclaimer: The views expressed belong exclusively to the author and do not reflect the views of this platform. This platform and its affiliates disclaim any responsibility for the accuracy or suitability of the information provided. It is for informational purposes only and not intended as financial or investment advice.

.png)