Open Interest Futures: How to Read Market Trends and Sentiment
2026-07-29
Open Interest (OI) is one of the most important yet often overlooked indicators in futures trading. OI represents the total number of derivatives contracts still open and unsettled in the market. The higher the OI, the more money is "locked" in active positions.
Unlike volume, which only counts transactions within a specific period, OI reflects traders' commitment to their positions and provides an idea of the strength of the current trend.
Key Takeaways
Open Interest (OI) is the number of futures contracts that are still open and have not been settled, as opposed to volume which only records transactions.
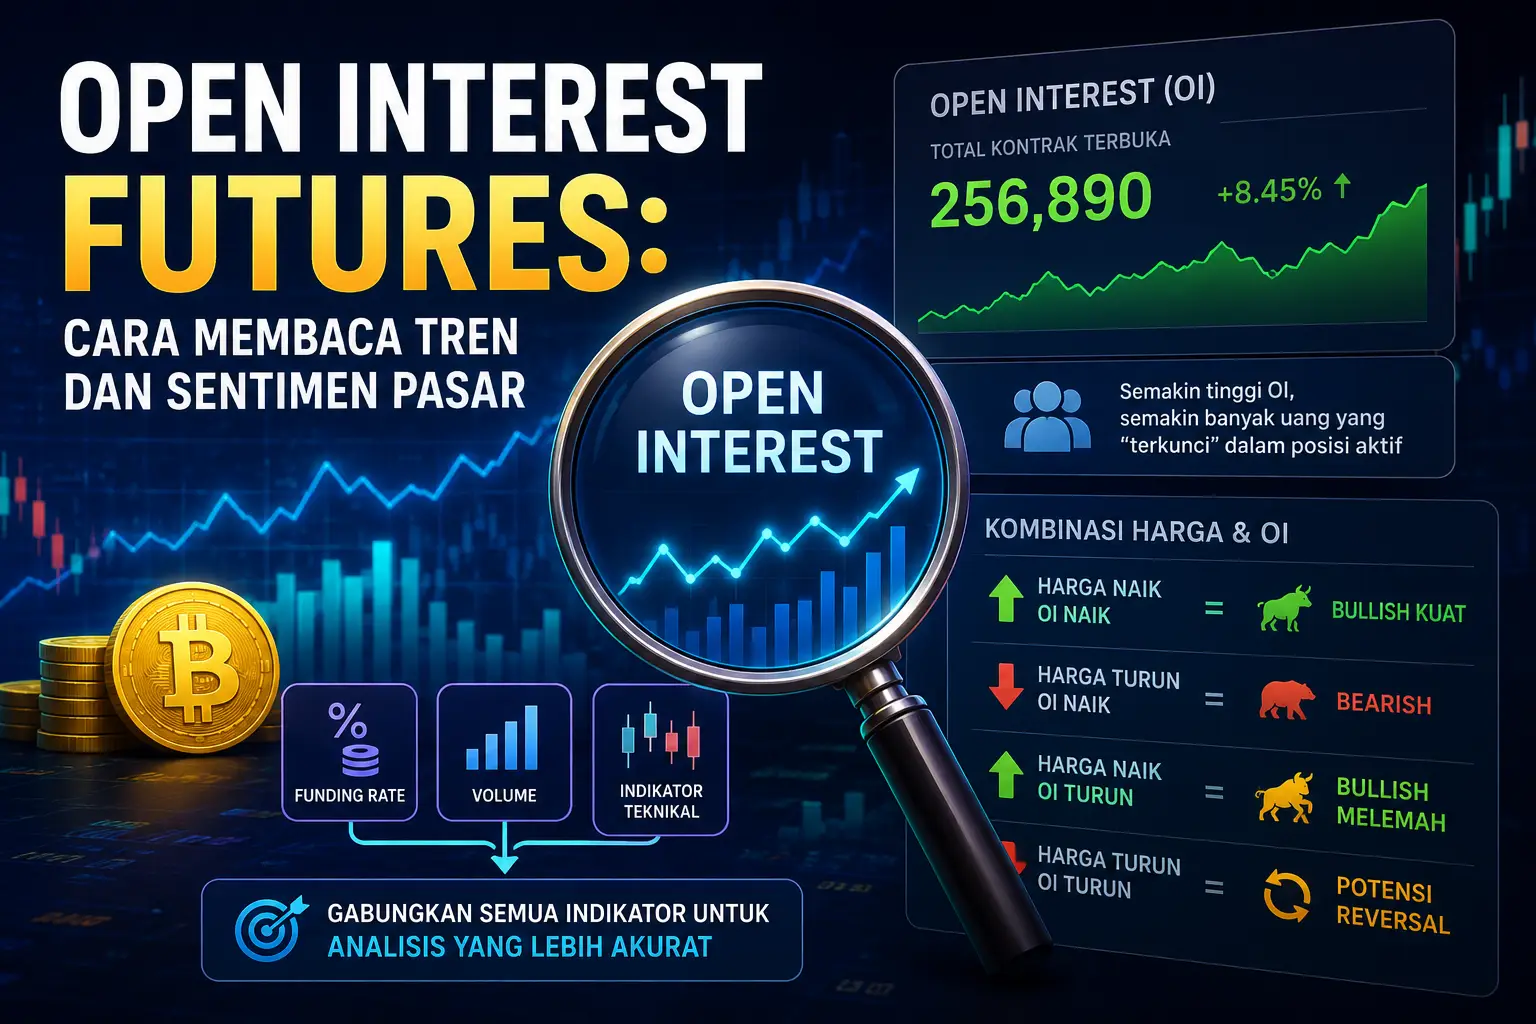
The combination of price and OI helps to read the strength of the trend: rising price + OI = strong bullish; falling price + rising OI = bearish; rising price + falling OI = weakening bullish; falling price + falling OI = potential reversal.
OI should be analyzed together with funding rate, volume, and other technical indicators for more accurate signals.
What is Open Interest in Futures Trading?
Source: AI
Open Interest is the total number of outstanding futures or options contracts in the market.
Each time a new contract is opened between a buyer and a seller, the OI increases by one. When a position is closed (either through take profit, stop loss, or execution), the OI decreases.
It is important to distinguish OI from volume:
- Volume:The number of transactions that occur in a certain time period (e.g.: 24 hours)
- Open Interest:Number of contracts that are still active and not yet completed
The analogy: volume is like the number of people coming in and out of a door in a day, while OI is like the number of people still in the room at a given time.
Read Also: How to Trade on Bittime Easily!
How to Read Open Interest Along with Price Movement
The power of OI lies in its combination with price movements. Here are four main scenarios:
Scenario 1: Price Rises + OI Rises (Strong Bullish)
This is the most bullish signal. When the price rises and the OI also increases, it indicates new money is entering the market and supporting the uptrend. Traders open new long positions, and the trend is likely to continue.
Scenario 2: Price Drops + OI Rises (Strong Bearish)
When the price falls but the OI rises, it indicates more traders are opening short positions, increasing selling pressure. This is a strong bearish signal.
Scenario 3: Price Rises + OI Falls (Weak Bullish)
A price increase accompanied by a decrease in the OI indicates that the increase was due to short covering, not new buying. This signals that the uptrend may be losing momentum and could potentially reverse.
Scenario 4: Price Drops + OI Drops (Weak Bearish)
A falling price accompanied by a falling OI indicates that long positions are being closed (long liquidation). This could be a sign that the downtrend is weakening and the market is ready to reverse.
Ready to apply Open Interest analysis in futures trading? Register at Bittime now and start trading with more optimal market insights.
Open Interest di Perpetual Futures
In perpetual futures (contracts without an expiration date), OI plays a more crucial role. Because the contract never expires, positions can remain open as long as the trader can maintain margin. Several factors influence OI in perpetual futures:
- Funding Rate:The periodic fee paid between long and short positions. A positive funding rate (longs pay shorts) often indicates an overbought market; a negative funding rate indicates an oversold market.
- Volatility:Spikes in volatility often lead to increased OI as more traders open positions to capitalize on price movements.
- Economic Data:Macro data releases (inflation, interest rates) can change market expectations and drive changes in OI.
Read Also: How to Avoid Margin Calls in Futures Trading: 5 Risk Management Tips
Combining Open Interest with Funding Rate
The combination of OI and funding rate provides a more complete picture of sentiment:
Limitations of Open Interest as an Indicator
Open Interest is a powerful tool, but it has limitations:
1. Not Differentiating Long/Short
A rising OI doesn't indicate whether the position is long or short. A rising OI can be either bullish (increasing long positions) or bearish (increasing short positions).
2. The Influence of Hedging
OI can rise due to hedging activity, not due to clear market direction expectations.
3. Need Context
OI should always be read in conjunction with price, volume, and other indicators. Relying on OI alone can be misleading.
4. Data Only in Derivatives
OI only applies to futures and options markets—it is not relevant in the spot market.
Strategy Using Open Interest
1. Trend Confirmation
If the OI increases in conjunction with a strong price trend, it confirms that the trend has sufficient momentum and liquidity. Traders can maintain their positions with greater confidence.
2. Detecting Potential Reversals
A decrease in OI while the price is moving in one direction can be a sign that the trend is starting to weaken. This is a signal to start watching for a reversal.
3. Avoid Market Traps
A high OI with low volatility could indicate market consolidation—a greater risk of a false breakout. It's best to wait for confirmation before entering.
4. Measure Sentiment
A sharp increase in OI when the price falls indicates a dominance of short positions, which could be a signal that the market is oversold and the potential for a short squeeze is high.
Read Also: What Is Return on Investment? Definition, Types, and How to Calculate It
Conclusion
Open Interest is a very useful indicator for understanding sentiment and trend strength in the futures market.
By reading the combination of price and OI, traders can identify whether market movements are supported by new liquidity or simply the result of closing old positions.
However, the OI is not a perfect tool; it doesn't differentiate between long and short positions and should be used in conjunction with other indicators such as funding rates, volume, and technical analysis. With the right understanding, the OI can be a valuable compass in navigating the volatile crypto derivatives market.

Maximize your opportunities in both bull and bear markets with Bittime Futures. Sign up and start trading now!
Bittime is a licensed and regulated Digital Financial Asset Trader (PAKD) supervised by Indonesia’s Financial Services Authority (OJK) — where you can buy Bitcoin in Indonesia and hundreds of other crypto assets starting from just Rp10,000. The registration process is fast, secure, and you can get started today.
Track USDT to IDR conversions and monitor your favorite crypto assets in real time. Everything is available in one crypto investment app that you can download for free on the Play Store
Ready to start? Register now on Bittime and execute your investment strategy with a platform trusted by millions of users in Indonesia.
FAQ
What is Open Interest?
Open Interest is the total number of futures or options contracts that are still open and unsettled in the market.
What is the difference between Open Interest and Volume?
Volume records the number of transactions in a certain period, while OI counts contracts that are still active and not yet closed.
What does OI up and price up mean?
This is a strong bullish signal, new money is coming into the market and supporting the uptrend.
What does OI up and price down mean?
This is a strong bearish signal, selling pressure increases, more short positions are opened.
What does OI down and price up mean?
Weak bullish, the rise is due to short covering, not new demand. The trend may be losing momentum.
What does OI down and price down mean?
Weak bearish, long positions closed, potential reversal to the upside.
Disclaimer: The views expressed belong exclusively to the author and do not reflect the views of this platform. This platform and its affiliates disclaim any responsibility for the accuracy or suitability of the information provided. It is for informational purposes only and not intended as financial or investment advice.

.png)


