Bitcoin Fails to Break US$81,000 – Can The Fed's CPI Decision Change the Direction?
2026-09-08
The 4‑hour BTC/USDT candlestick on Bittime this morning sits right at $78,861.51 — down a slight 0.06% from the open. This seemingly small number actually holds a bigger story: over the past three weeks, Bitcoin price has attempted to break the $81,000 level three times, and each time failed to hold above it.
Bitcoin resistance around that level has become a critical point that will determine the market's direction ahead of two major The Fed events this week.
Key Takeaways
- Bitcoin fails to break US$81,000 resistance after August US jobs data came in much stronger than expected, pushing the odds of a Fed rate hike to around 60%.
- Despite the price stall, US spot Bitcoin ETFs have posted positive inflows for three consecutive weeks, and realized capitalization continues to rise, signalling that institutional demand remains intact.
- The August CPI data (September 11) and the FOMC meeting (September 15–16) are the two catalysts that will determine whether Bitcoin can break out of the $77,000–$82,500 range.
Bitcoin Stalls Below US$81,000 Resistance
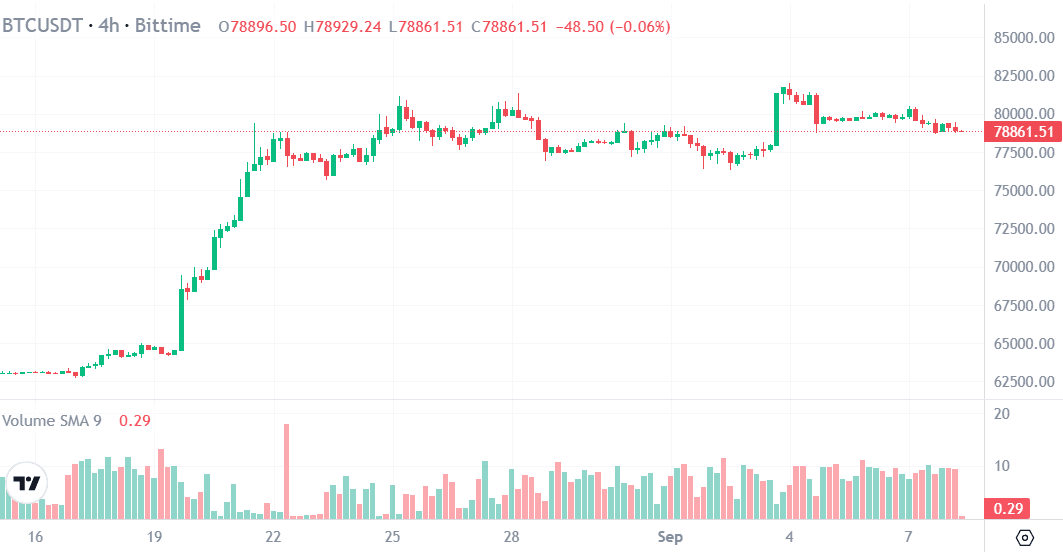
Bitcoin's rally throughout August 2026 was actually quite impressive — the price surged from below $63,000 to an intraday high above $82,000, marking its strongest monthly performance in some time.
However, as September began, that momentum started to fade. Tokenomist noted that Bitcoin touched the $81,000 level for the third time in two weeks on September 3, but again failed to hold above it.
According to a report by AltcoinGordon, the failure to break $81,000 has shifted traders' focus entirely to the Fed's meeting this month. That level is said to act as a resistance point where consistent selling pressure from short-term holders emerges every time the price approaches it.
It is important to note that a rejection at such a resistance level does not automatically mean the trend is reversing — rather, it reflects a temporary equilibrium between buyers and sellers, with no clear dominance from either side.
If you want to monitor Bitcoin's movements in real-time while waiting for clearer direction from the Fed, you can check the chart and start trading directly on Bittime.
US Jobs Data Triggers Sentiment Reversal
Market sentiment had improved on September 3 after Fed Governor Christopher Waller made comments that leaned neutral on the interest rate outlook. Yahoo Finance reported that those remarks triggered a 5% Bitcoin rally and net inflows of $730.8 million into Bitcoin ETFs in a single day.
Unfortunately, that euphoria did not last long. The August jobs report released in early September showed a gain of 162,000 jobs — far above economists' projections of 55,000–56,000, while the unemployment rate held steady at 4.1%.
This overly strong data turned into bad news for Bitcoin: the market interpreted it as a reason for the Fed to hold or even raise rates, rather than cut them.
Read Also: How to Buy BTC: A Complete Guide for Beginners in Indonesia (2025)
CryptoSlate noted that Bitcoin briefly dropped to an intraday low of $78,660 after the data release, while TechTimes reported total crypto liquidations over 24 hours reached roughly $757 million, with about $200 million of that being long-position liquidations occurring in just one hour following the data release.
According to The Block, the probability of a 25‑basis‑point rate hike by the Fed on September 16 rose to around 60% based on the CME FedWatch tool — up from a nearly balanced 50:50 between holding and hiking.
Interestingly, this pressure came amid open calls from President Trump on his social media platform for the Fed to lower rates. The market reaction moved in the opposite direction — proof that real economic data remains the primary driver of monetary policy expectations, not political pressure alone.
Read Also: Bitcoin Whitepaper in Indonesian: Complete Guide and Discussion
What to Watch Before the September FOMC Meeting
Despite short-term price pressure, several indicators suggest that the foundation of Bitcoin demand has not truly faltered. The Block reported that US spot Bitcoin ETFs still saw net inflows of $987 million over the past week, extending the positive inflow trend to three consecutive weeks.
CryptoQuant analyst Axel Adler Jr. also noted that Bitcoin's realized capitalization rose by $9.36 billion over the past 30 days to $1.068 trillion — an indicator that coins are changing hands at higher prices, a positive signal even as the price remains capped.
On the derivatives side, CoinStats noted that Bitcoin futures funding rates remain positive but relatively low at 4.39% annualized, while open interest fell by 1.64% — suggesting traders are cautious and reducing leveraged exposure ahead of clarity from the Fed.
Read Also: 10 Free Bitcoin Mining Sites and Faucets 2026 – Which Ones Are Legit?
QCP Capital, as quoted by The Block, placed short-term resistance at the $80,000–$82,000 range with support at $77,000–$78,000.
Two major events now determine the next direction. US August CPI inflation data is scheduled for release on September 11, with Capital.com analyst Kyle Rodda projecting headline inflation to hold at 3.4% year‑on‑year while core CPI falls to 2.4%.
If this data shows convincing disinflation, the Fed could hold rates steady at the September 15–16 FOMC meeting — on the other hand, a hotter‑than‑expected number could reopen the door for a rate hike.
OTC trader Wintermute's Jasper De Maere cited $75,000 and $82,000 as two key levels the market is watching ahead of the FOMC meeting, while LMAX Group analyst Joel Kruger said a convincing break above $82,820 could open the path for Bitcoin to $100,000 — as reported by TechTimes.
Read Also: How to Buy Bitcoin (BTC) with QRIS: A Practical Guide for Beginners
Conclusion
Bitcoin currently stands at a critical crossroads: the price is capped below $81,000 resistance after stronger‑than‑expected US jobs data pushed Fed rate expectations in a more hawkish direction, yet institutional demand fundamentals — from ETF inflows to realized capitalization — still show positive trends.
Two major catalysts this week — the August CPI release on September 11 and the FOMC decision on September 15–16 — will determine whether Bitcoin can break out of its $77,000–$82,500 consolidation range or remain stalled longer while waiting for clearer monetary policy direction.
Check the prices of Bitcoin (BTC), Ethereum (ETH), XRP, Solana (SOL), GRAM, and BNB, as well as top memecoins like DOGE. You can trade directly on Bittime!

Bittime is a licensed Digital Financial Asset Trader (PAKD) platform, registered and supervised by the Indonesian Financial Services Authority — where you can buy Bitcoin in Indonesia and hundreds of other crypto assets starting from Rp10,000. Registration is quick, secure, and you can start today.
Monitor the USDT to IDR conversion rate and real‑time price movements of your favourite crypto assets. All available in one crypto investment app available for free download on the Play Store.
Ready to start? Sign up now on Bittime and execute your investment strategy on a platform trusted by millions of users in Indonesia.
FAQ
Why did Bitcoin fail to break US$81,000?
Bitcoin stalled at this level due to selling pressure from August US jobs data that came in much stronger than expected, which increased the probability of a Fed rate hike.
What is the impact of The Fed's decision on Bitcoin price?
The Fed's interest rate decision influences risk appetite broadly; rate hikes tend to pressure risk assets like Bitcoin, while rate holds can provide room for upside.
When are the August CPI data and the September 2026 FOMC meeting?
The US August CPI inflation data is scheduled for release on September 11, while the FOMC meeting takes place on September 15–16, 2026.
Are Bitcoin ETF inflows still positive despite the price stall?
Yes, US spot Bitcoin ETFs recorded net inflows of $987 million over the past week, extending the positive trend to three consecutive weeks.
What are the current support and resistance levels for Bitcoin?
According to QCP Capital, short-term resistance lies in the $80,000–$82,000 range, while support is at $77,000–$78,000.
Disclaimer: The views expressed belong exclusively to the author and do not reflect the views of this platform. This platform and its affiliates disclaim any responsibility for the accuracy or suitability of the information provided. It is for informational purposes only and not intended as financial or investment advice.

.png)