PUMP Price Analysis for October 2026: Still Bullish or a Correction?
2026-10-01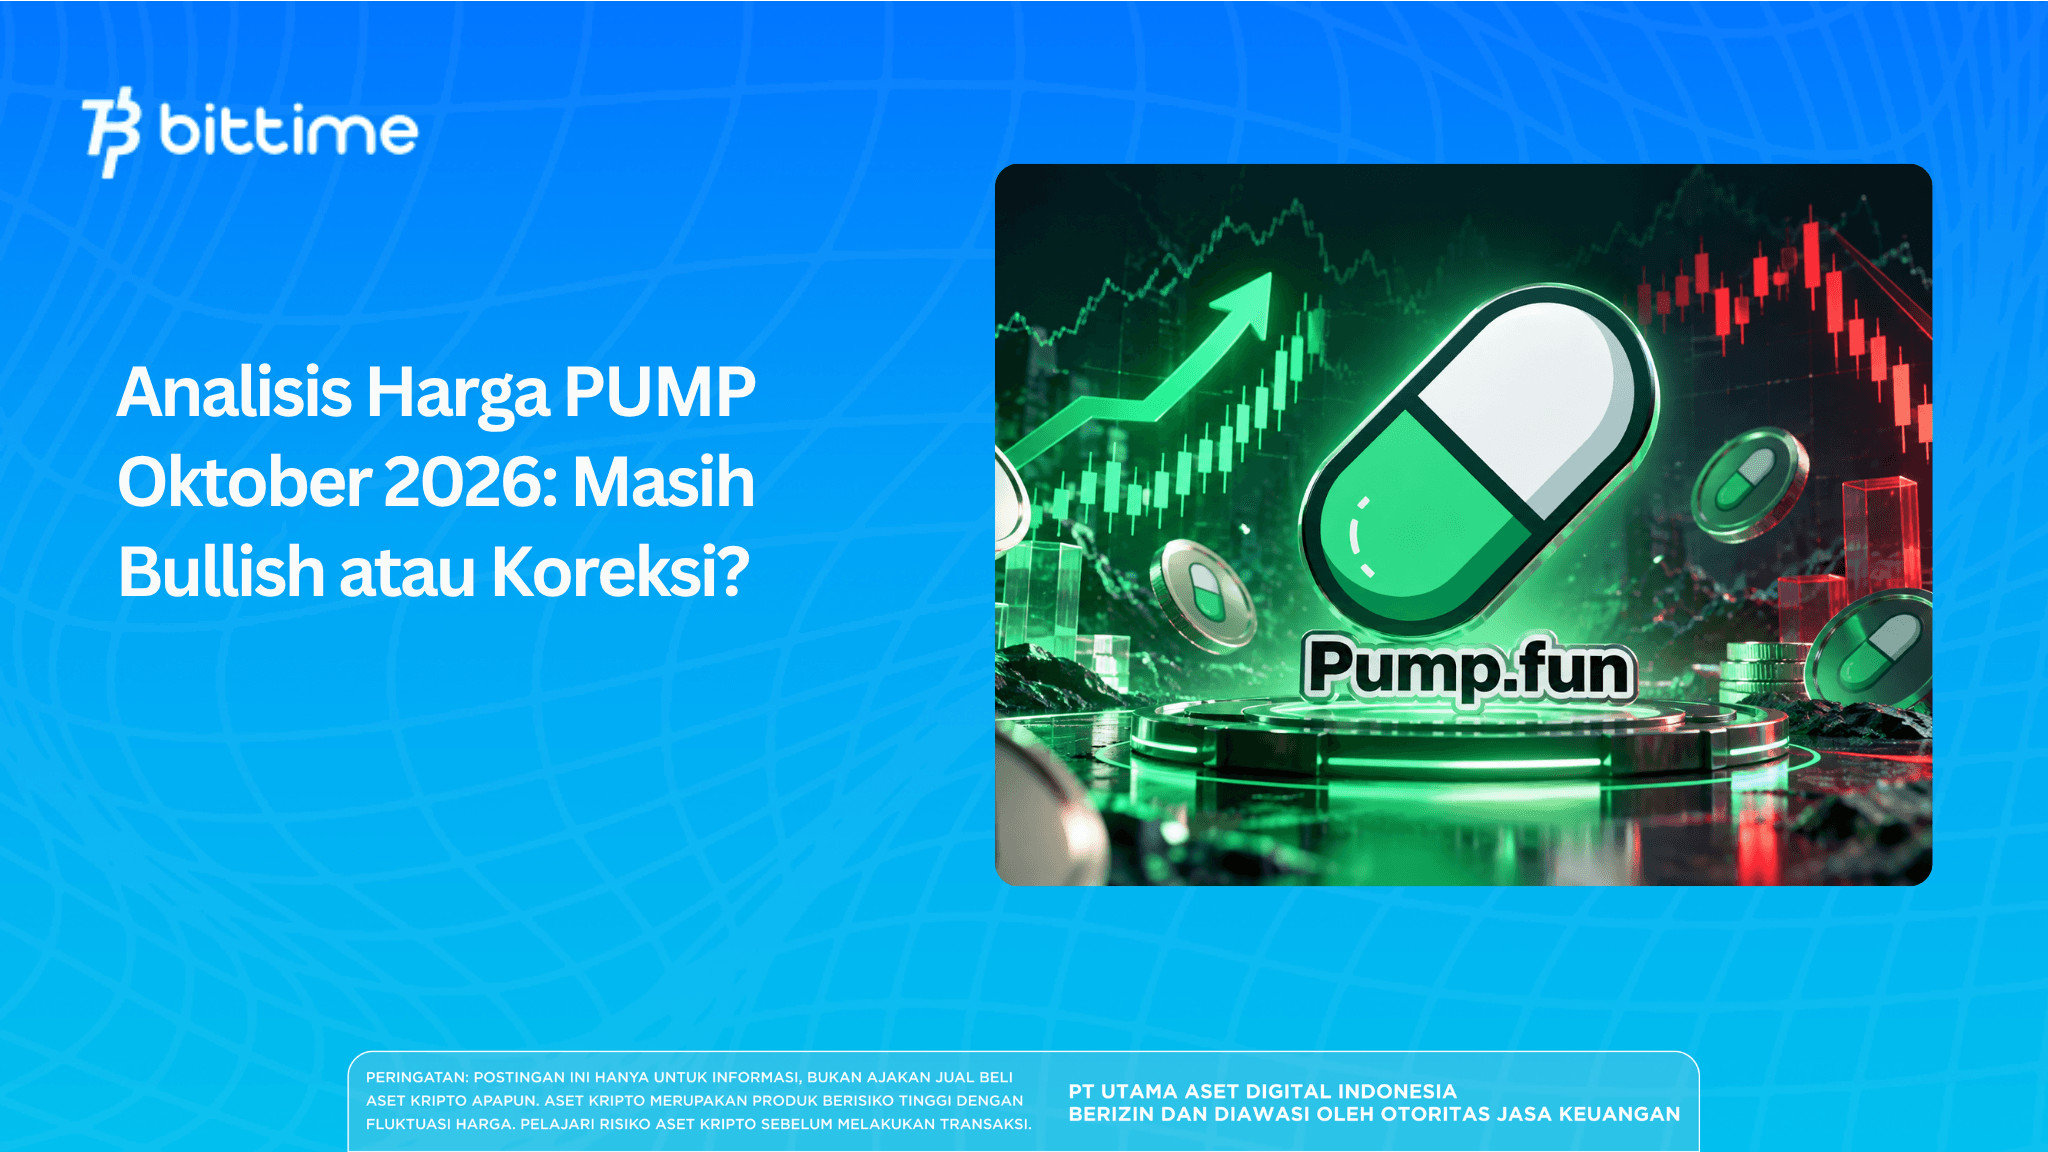
PUMP price analysis in early October 2026 shows a weekly increase accompanied by a daily correction. In the snapshot taken on October 1 at 16:40 WIB, PUMP was at US$0.005603, down 5.07% over 24 hours but still up 36.95% over seven days. Is this decline merely a pause after the rally, or the beginning of a larger downturn?
The answer needs to be assessed through price changes, volume strength, and developments in the Pump.fun ecosystem. This article discusses the latest data, price areas to watch, and bullish, neutral, and bearish scenarios for short-term monitoring. All scenarios are conditional and should be updated as market conditions change.
Key Takeaways
- PUMP is still posting a weekly gain, but the daily correction makes momentum confirmation important.
- The 24-hour price boundaries can serve as an initial reference, but they are not automatically strong support and resistance levels.
- Buybacks and burns can affect demand and supply, but they do not guarantee a token price increase.
Latest PUMP Price Analysis: Weekly Gain, Daily Correction
Data as of October 1, 2026, at 16:40 WIB shows a divergence between daily and weekly movements. The price weakened over 24 hours, while the seven-day performance remained positive.
This distinction matters because a single bearish candle is not enough to conclude that the uptrend has ended. Conversely, a weekly gain does not prove that the price will keep rising without a correction.
To interpret this situation, separate two questions. First, is the price still maintaining its upward structure? Second, are buyers still willing to enter as the price approaches its latest highs?
A price decline after a rally may reflect profit-taking, weakening demand, or changing market conditions. Without sufficient transaction data and chart information, the cause cannot be determined from the percentage decline alone.
How to Read Price Data Correctly
A price snapshot provides a picture at a specific moment. It does not replace the price available when you actually place a trade.
Use the same trading pair and platform when comparing charts. Differences in update times, liquidity, and calculation methods can produce different figures across platforms.
If you monitor PUMP in rupiah, check the price on the PUMP/IDR pair. Do not assume that converting the dollar price will produce the same transaction price, as exchange rates, spreads, and fees can affect the result.
Read also: PUMP Price Targets $0.0055 as Trader Opens a $4.7 Million Long!
PUMP Price Levels to Watch
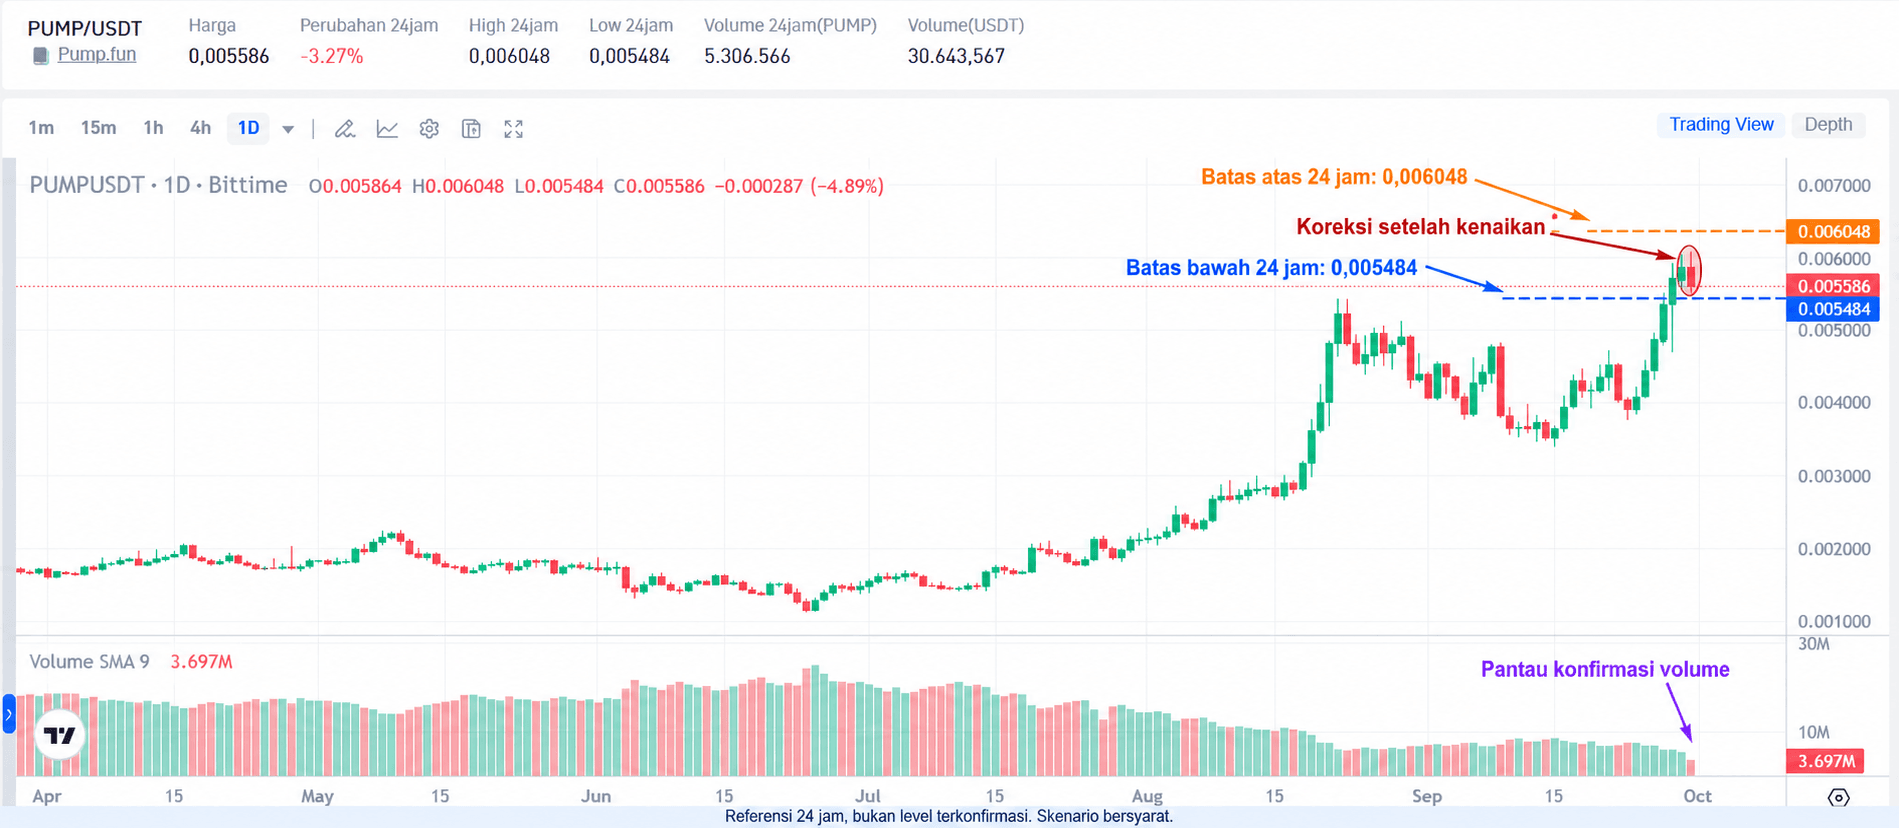
Bittime PUMP/USDT chart, 1D timeframe. Annotations show the 24-hour price boundaries and the area for monitoring momentum. The data is a snapshot from when the image was taken.
The daily PUMP/USDT chart on Bittime shows an increase followed by a corrective candle at the end. When the screenshot was taken, the price was 0.005586 USDT, with a 24-hour range between 0.005484 and 0.006048 USDT.
These two boundaries are an initial reference for monitoring the next move, not confirmed support and resistance. A move beyond the range should be evaluated through candle closes, the price response after the breakout, and trading volume.
A market snapshot at 14:55 WIB on the same day showed a 24-hour range of approximately US$0.005489 to US$0.006050. These lower and upper boundaries can be used as an initial observation reference.
However, the daily low is not automatically strong support. Similarly, the daily high may not remain resistance in the following period.
Lower Area: Watch Buyers’ Response
When the price approaches the lower boundary of the range again, observe whether the decline stops and buying emerges strongly enough to drive a recovery. This response is more useful than simply marking the lowest price.
Also check how the candle closes. A price that dips and then recovers before the candle closes means something different from a price that remains below the area.
If the lower boundary is breached, look for the next reaction area on the chart. Do not assign a downside target using an estimated figure without a basis in swing lows, previous consolidation, or a clear analytical method.
Upper Area: Wait for Breakout Confirmation
As the price approaches the upper boundary of the range, watch whether the rise is supported by volume. A brief spike that quickly reverses may signal that buyers have not been able to sustain the price.
A breakout is more suitable for evaluation after the candle on the selected timeframe has closed. A retest of the breached area can also help determine whether that level is beginning to receive buying support.
Use timeframes consistently. A breakout on a 15-minute chart does not immediately prove a trend change on the daily chart.
Read also: HYPE and PUMP Buybacks: Can the Strategy Push Prices Higher?
PUMP Price Prediction: Three Short-Term Scenarios
The following PUMP price outlook is a monitoring framework for the next few days. It does not set technical targets beyond the range, as that would require a more complete chart review.
1. Bullish Scenario: Price Breaks Out of the Range and Holds
The bullish scenario gains support if the price breaks above the observed range, holds after the candle closes, and shows supportive trading activity. A successful retest can add evidence that buyers remain active.
Be cautious if the price only breaks out briefly before returning to the range. This weakens the basis for the upside scenario.
The next target should be derived from historical areas on the chart. Do not assume every breakout will produce the same percentage gain.
2. Neutral Scenario: Price Continues Moving Within the Range
The neutral scenario applies if the price has not been able to break out of the range convincingly. Buyers and sellers continue to counterbalance each other without a clear new direction.
In this situation, chasing the price in the middle of the range can make it difficult to define risk limits. There is not yet strong evidence showing whether the price will approach the upper boundary or retest the lower one.
Watch for a narrowing price range and changes in volume. Both can help prepare your monitoring plan, but they do not determine the breakout direction before a breakout occurs.
3. Bearish Scenario: The Lower Boundary Breaks and Recovery Fails
The bearish scenario strengthens if the price breaks below the lower boundary, closes beneath it, and fails to reclaim it during a recovery attempt. This indicates that the area that previously limited the decline is no longer strong enough.
A decline accompanied by increased selling activity deserves further attention. However, volume alone does not reveal who is selling or why they are trading.
If the price reclaims the lost area, the bearish scenario should be reassessed. Good analysis specifies invalidation conditions, not just downside targets.
Read also: FOMO vs. Pump.fun: Which Platform Is More Suitable for Traders?
What Is PUMP Coin and How Is It Related to Pump.fun?
PUMP is the native token of the Pump.fun. Pump.fun is known as a platform for creating and trading Solana-based meme tokens.
PUMP should be distinguished from the tokens created by users through the platform. Buying PUMP does not mean you own all tokens launched on Pump.fun.
Because it is connected to platform activity, PUMP analysis should look beyond the price chart. Changes in usage, fee revenue, and token policies may affect how the market values this asset.
Nevertheless, owning PUMP is not the same as owning company shares. The token does not provide rights to the platform’s revenue, profits, or dividends.
Read also: Pump.fun Launches Callout Rewards, Offering Tokens for Trading Referrals
PUMP Buybacks: How Do They Work?
A buyback mechanism uses funds to purchase tokens from the market. If the purchased tokens are then burned, they are removed from the circulating supply.
The mechanism displayed by Pump.fun cites a target allocation of around 50% for PUMP buybacks and burns. However, the program should not be interpreted as a guarantee that purchases will always occur at a fixed amount.
Buybacks can add demand at certain times. A reduction in supply can also affect market balance, but the impact still depends on demand and selling pressure.
The price can fall even while buybacks are underway if token holders sell more. Therefore, buyback narratives should be compared with actual transaction execution and real changes in supply.
The platform dashboard also notes that displayed revenue and buyback figures may not be fully accurate following the introduction of custom pairs. Aggregate figures should be checked again before being used as the basis for a conclusion.
Read also: Pump.fun Accused of Being a “Casino of Scams”: Here Is the Controversy
5 Factors That Affect PUMP’s Price
1. Platform Activity and Revenue
User activity is relevant because it helps evaluate the use of Pump.fun. However, a large number of tokens created does not automatically prove revenue growth or sustained usage.
Compare several metrics, such as trading volume, active users, and fee revenue. Pay attention to the period and definitions so the comparison is not misleading.
2. Buyback and Burn Execution
A program announcement should be distinguished from its execution. Check whether token purchases and burns can be verified through the relevant transactions.
Do not look only at cumulative figures. Recent changes in activity are more useful for determining whether the mechanism is still operating as described in the available information.
3. Token Supply
Circulating supply and changes in token availability can affect market pressure. If there is a token release schedule, check the dates, amounts, and recipients.
A token release does not always lead to immediate selling. Its impact depends on holder behavior and the market’s ability to absorb the additional supply.
4. Liquidity and Trading Volume
Liquidity affects how easily a trade can be executed at the expected price. A thin order book can cause large transactions to move the price further.
Volume should also be read alongside price changes. High volume does not automatically mean buying is dominant, because every transaction involves both a buyer and a seller.
5. Crypto Market Conditions and Competition
Monitor movements in Bitcoin and Solana, as well as sentiment toward the meme coin sector. Their relationship with PUMP can change, so correlation should not be assumed to remain constant.
Competition among token-launch platforms should also be considered. Evaluate whether user activity is holding steady or shifting to other services.
Advantages and Risks of PUMP Coin
PUMP is connected to a platform whose activity can be observed. This provides additional material for analysis compared with tokens that offer only a narrative without verifiable usage.
The buyback and burn mechanism also provides token-related factors that can be evaluated. However, neither guarantees an inexpensive valuation or profits for buyers.
Risks to consider include:
- Rapid price changes following a major rally.
- A decline in platform activity when interest in meme coins weakens.
- Additional supply and potential selling by token holders.
- Changes in buyback policies or execution.
- Misinterpretation of dashboards and data that has not been updated.
- Liquidity risks, technology security risks, and changes in access due to regulation.
5 Steps to Take Before Making a Decision
- Check the live price. Make sure you use data that matches the time of your transaction.
- Define the analysis period. Separate plans for trades lasting several days from long-term holdings.
- Write down the triggers and invalidation conditions. Specify when a scenario applies and when it should be abandoned.
- Calculate your risk limits. Consider position size, spreads, fees, and possible slippage.
- Record the evaluation results. Compare the initial scenario with price developments so the analysis process can be improved.
[HUMAN EDIT REQUIRED - Add personal experience or first-hand insight here: add the author’s observations from a chart that was actually reviewed, including an example of a scenario that held or was invalidated; do not fabricate trading experience.]
If you want to continue monitoring, you can register on Bittime and open the PUMP price. Always check the price and available product information before making a transaction.
What Should You Monitor Next?
The next monitoring priorities are the price’s ability to break out of the range, the quality of volume confirmation, and developments in platform activity. These three factors are more useful than sticking to old targets after market conditions change.
Update the analysis when a confirmed breakout occurs, a material supply change takes place, or token policies change. The update date should reflect a revision to the content, not merely the change of month.
Conclusion
PUMP price analysis in early October shows a weekly gain accompanied by a daily correction. The next direction should be assessed through the price response at range boundaries, chart confirmation, and verified fundamental developments.
Buybacks can be a supporting factor, but they do not replace checks on liquidity, supply, and selling pressure. Use scenarios together with their invalidation conditions, then monitor the latest price through Bittime before making a decision.

Bittime is a licensed Digital Financial Asset Trader (PAKD) platform supervised by the Financial Services Authority (OJK) — where you can buy Bitcoin in Indonesia and hundreds of other crypto assets starting from IDR 10,000. Registration is quick and secure, and you can get started today.
Track the conversion of USDT to IDR and the real-time price movements of your favorite crypto assets. Everything is available in one crypto investment app that can be downloaded for free from the Play Store.
Ready to get started? Register on Bittime now and execute your investment strategy on a platform trusted by millions of users in Indonesia.
FAQ
What is the latest PUMP price?
In the snapshot taken on October 1, 2026, at 16:40 WIB, PUMP was priced at US$0.005603. This is not a live price at the time you read the article, so check the transaction price again.
Is PUMP coin still bullish?
The weekly gain indicates positive performance, but the daily correction means further confirmation is needed. The bullish scenario becomes stronger if the price breaks above the upper monitored area and manages to hold it.
How do you determine PUMP support and resistance?
Use a chart for a consistent trading pair and timeframe, then examine swing highs, swing lows, and areas of repeated reaction. The 24-hour price boundaries are only an initial reference and are not automatically strong support or resistance.
Do PUMP buybacks guarantee a price increase?
No. The price is also affected by selling pressure, liquidity, and changes in supply. Buybacks should be verified and then compared with market conditions over the same period.
Is PUMP the same as a meme token on Pump.fun?
No. PUMP is the native token of the Pump.fun ecosystem, while users can create many different tokens through the platform. Buying PUMP does not give you ownership of all those tokens or rights to platform dividends.
Disclaimer: The views expressed belong exclusively to the author and do not reflect the views of this platform. This platform and its affiliates disclaim any responsibility for the accuracy or suitability of the information provided. It is for informational purposes only and not intended as financial or investment advice.

.png)