ON Price Analysis: Why Does Orochi Network Continue to Fall?
2026-11-11
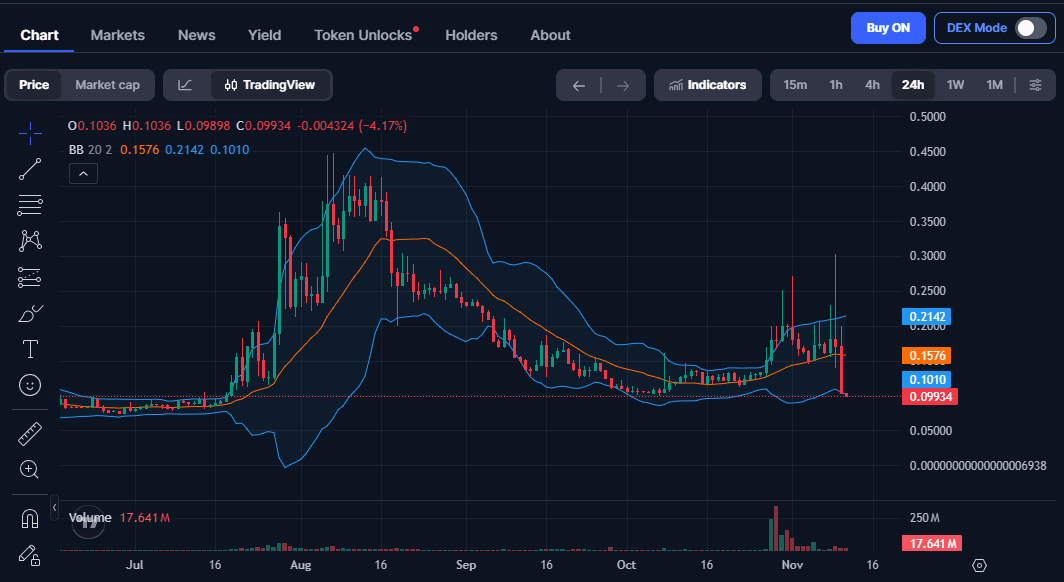
ON price analysis shows a sharp decline after the Orochi Network token lost nearly 40% of its value in just 24 hours. On November 11, 2026, ON was trading at around US$0.10, far below its August peak. Such a steep drop has prompted investors to question whether selling pressure will continue or whether a recovery opportunity may emerge.
ON's decline comes amid a broader correction in the cryptocurrency market. However, its losses have been much deeper than the market average, drawing attention to liquidity conditions, trading activity, and token distribution. Understanding the situation requires looking beyond a single day's price movement.
Key Takeaways
- ON fell nearly 40% in 24 hours and was trading around US$0.10 on November 11, 2026.
- ON's decline was more severe than the broader crypto market correction, with liquidity and changes in token supply among the key risks to watch.
- The US$0.10 area is an important price zone, while the possibility of a rebound still needs confirmation from price action and trading volume.
ON Price Today: How Far Has It Fallen?
Orochi Network's price came under significant pressure during trading on November 11, 2026. According to CoinGecko data at the time of monitoring, ON was trading at approximately US$0.09918, down 39.9% in 24 hours and 38.5% over the previous seven days.
CoinMarketCap reported a similar price of approximately US$0.09990, with a daily decline of 39.3%.
Such differences are normal because platforms update their figures at different times and use different data collection methods.
Here is an overview of ON's market conditions at the time of monitoring:
Data reflects observations from November 11, 2026, and may change as trading activity continues.
ON Has Fallen Nearly 78% From Its Peak
Orochi Network reached an all-time high of around US$0.447 on August 7, 2026. Compared with its current price, its value has fallen by nearly 78%.
This decline highlights how significantly market sentiment toward ON has shifted in recent months.
However, trading far below an all-time high does not automatically make a token cheap. Its value must also be assessed in the context of the project's condition, liquidity, and circulating supply.
Read also: CYBER Price Rises Ahead of Token Unlock: What Are the Risks?
Why Does Orochi Network's Price Remain Under Pressure?
ON's decline is clearly visible on its price chart. However, identifying the exact cause is not as simple as looking at the percentage lost in one day.
Price and volume data alone cannot establish whether the pressure comes from major investors, short-term trading activity, or other factors.
Nevertheless, several market conditions may help explain why ON has experienced such a sharp decline.
1. Selling Pressure Has Outweighed Buying Demand
When prices fall rapidly, one possible explanation is that sell orders exceed demand at previous price levels.
Sellers become willing to part with tokens at progressively lower prices, while buyers are not aggressive enough to stop the decline.
These conditions can persist if market confidence has not yet recovered.
Even so, falling prices do not necessarily mean large investors are selling their holdings. Without more detailed transaction data, neither the identities of sellers nor their reasons for selling can be confirmed.
2. Liquidity Makes ON's Price More Sensitive
Liquidity indicates how easily an asset can be traded without causing significant price changes.
For tokens with relatively small markets, large sell orders can push prices down more quickly when there are not enough buyers at nearby price levels.
This creates an additional risk for ON, whose market capitalization is much smaller than that of major cryptocurrencies.
When liquidity thins, the spread between buy and sell prices may also widen. As a result, investors may have to accept less favorable prices when selling large positions.
3. A Broader Crypto Market Correction Has Weakened Sentiment
ON's decline has occurred while conditions across the broader crypto market have also been unfavorable.
Over the same seven-day period, CoinGecko recorded a decline of approximately 5.5% in the global cryptocurrency market. ON, meanwhile, fell by around 38.5%.
That considerable difference shows that ON is facing much stronger pressure than the market overall.
Negative market conditions can certainly worsen investor sentiment toward altcoins. However, this performance gap also suggests that ON trading may be affected by specific factors that require further investigation.
Read also: SHIB Falls Sharply: Should Holders Sell or Hold?
What Is Happening to ON Trading Volume?
Trading volume is an important indicator because it shows how actively an asset is being bought and sold.
On November 11, 2026, CoinGecko recorded approximately US$9.74 million in ON trading volume over 24 hours, down about 49% from the previous day.
CoinMarketCap, meanwhile, showed trading volume of around US$17.7 million.
This difference may result from variations in the exchanges and trading pairs covered, as well as differing calculation methods.
Does Falling Volume Mean Selling Pressure Is Ending?
Not necessarily.
Lower volume after a sharp decline may indicate that trading activity is slowing. However, that alone does not confirm that buyers have regained control of the market.
If prices continue falling even as transaction activity declines, demand may still be too weak to support a recovery.
Conversely, if ON begins to stabilize and buying volume rises consistently, the market may start showing signs of a shift in sentiment.
Volume should therefore be assessed alongside price action, rather than used as the sole basis for determining whether the bearish trend has ended.
Read also: BUILDon (B) Price Prediction 2026: Why Is B Coin Rising?
ON Technical Analysis: Support and Resistance Levels
After a sharp decline, traders generally turn their attention to price areas that could become new points of equilibrium.
ON is currently trading at around US$0.10, after previously trading at higher price levels.
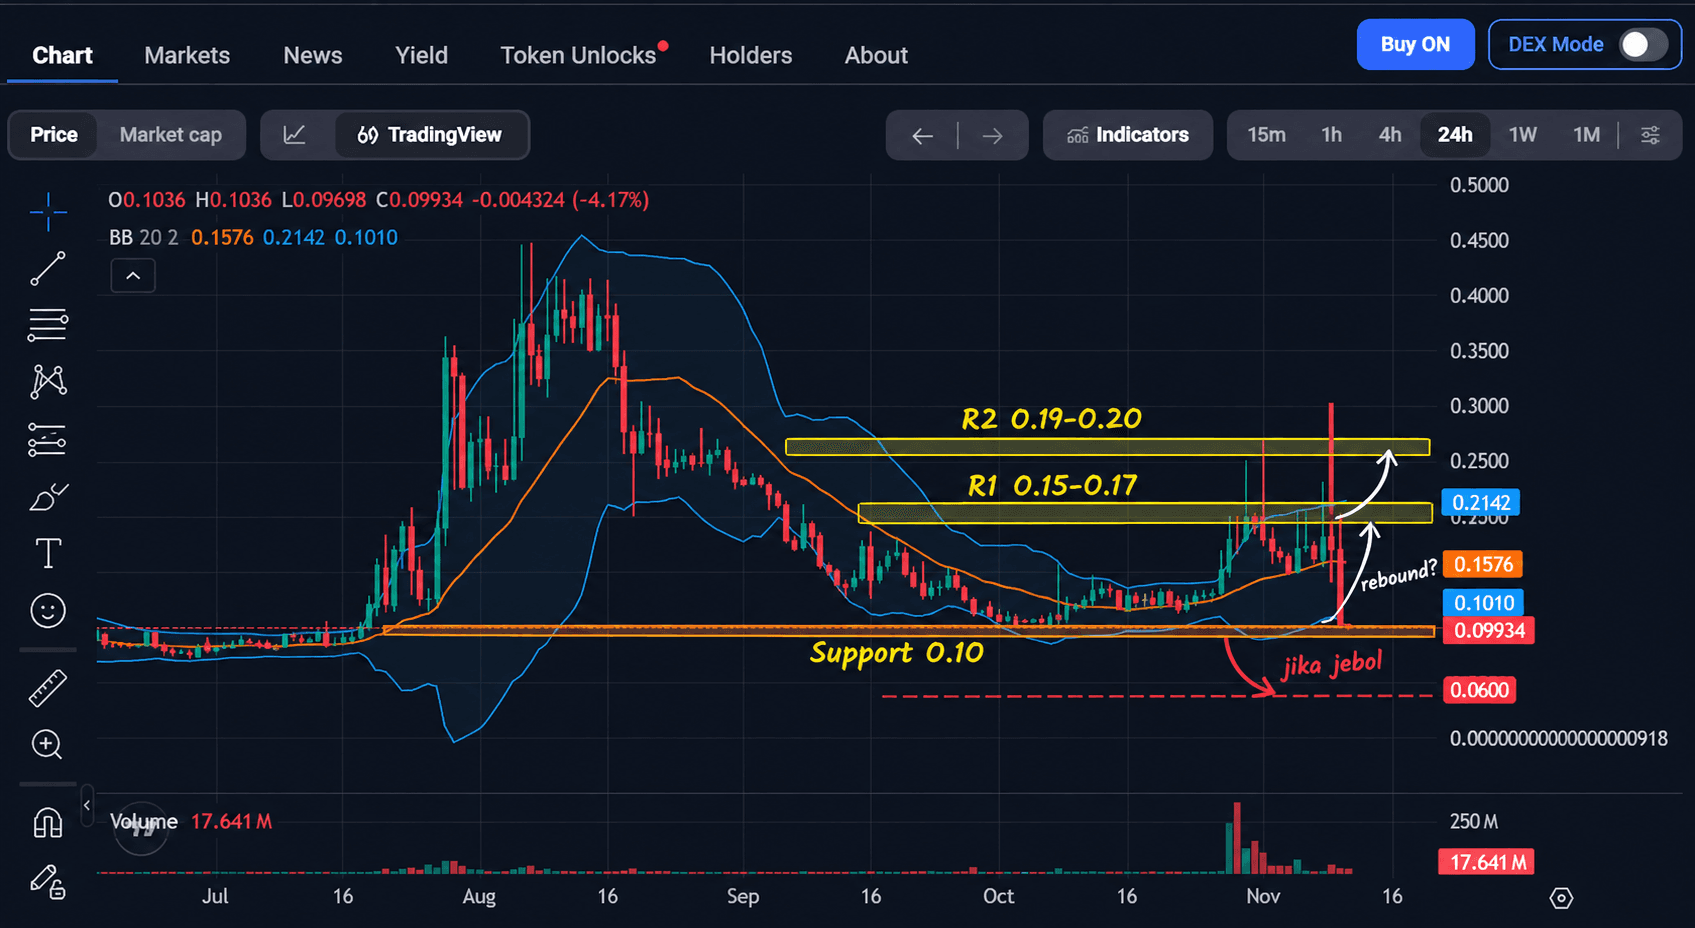
Based on the available price history, the following zones may serve as initial reference points for monitoring ON.
These levels are observation zones based on historical price action, not thresholds that are guaranteed to hold or be reached.
Can US$0.10 Stop the Decline?
The US$0.10 area is attracting attention because it is close to ON's latest trading price. If buyers begin stepping in and the price can hold above this zone, the market may have an opportunity to consolidate.
However, if ON continues to trade below US$0.10 without sufficient buying support, further losses remain possible. What matters is not only whether the price touches a particular level, but also how the market reacts afterward.
A pattern of higher lows, accompanied by improving buying activity, could provide a clearer picture of the strength of support.
Resistance Levels to Watch if ON Rebounds
If ON recovers from selling pressure, the US0,15–US0,17 area is one zone worth watching. This range corresponds to prices traded before the correction deepened.
Above that, the US0,19–US0,20 range could serve as the next resistance reference.
Nevertheless, a rise toward resistance does not automatically signal a new bullish trend. ON needs to demonstrate that it can sustain its gains before a recovery can be considered more convincing.
Read also: WWAR Price Prediction: Can World War Asset Reserve Reach $0.1?
Do Token Unlocks Affect ON's Price?
Beyond trading conditions, tokenomics is another important aspect of Orochi Network price analysis. ON has a maximum supply of 1 billion tokens, while its reported total supply is approximately 700 million ON.
Not all of those tokens are currently counted as circulating supply.
Why Do ON Circulating Supply Figures Differ?
CoinMarketCap and CoinGecko report substantially different circulating supply figures.
This difference affects market capitalization calculations because circulating token supply is one of the metrics used to determine market cap.
The two platforms may apply different classification methods or update schedules. However, the precise reason for the discrepancy cannot be established without further explanation.
Investors should therefore use data from the same source when comparing ON's valuation with that of other assets.
Could Token Unlocks Add to Selling Pressure?
Token unlocks make previously locked assets available in accordance with their distribution schedules.
If some recipients decide to sell those tokens, the amount of supply offered on the market could increase. This may put downward pressure on prices if demand cannot absorb the additional supply.
However, unlocked tokens are not necessarily transferred to exchanges or sold immediately.
Based on the market data used in this article, there is insufficient evidence to conclude that selling related to token unlocks directly caused ON's price decline on November 11, 2026.
Distribution schedules remain important to monitor, but conclusions should not be drawn without supporting transaction data.
Read also: Collector Crypt (CARDS) Price Prediction 2026: Can It Still Rise?
What Are Orochi Network's Fundamentals?
Orochi Network is a blockchain infrastructure project developing technologies to improve data verification, information integrity, and privacy protection.
Its focus is on helping applications use data whose authenticity can be verified without revealing all sensitive information.
To achieve this goal, Orochi Network is developing several cryptographic approaches.
- Zero-Knowledge Proofs (ZKP): Allow information to be verified without disclosing all the underlying data.
- Proof Carrying Data: Links data to evidence that can be used to verify its validity.
- Fully Homomorphic Encryption (FHE): Enables certain types of computation to be performed on data while it remains encrypted.
These technologies have potential applications across a range of use cases requiring trustworthy data management.
Could Project Development Support a Price Recovery?
Technological progress could attract greater investor attention to Orochi Network, particularly if development leads to real-world product adoption.
However, technical success is not always immediately reflected in a token's price. ON's value remains influenced by market demand, the token's role in the ecosystem, supply distribution, and liquidity conditions.
Product development should therefore be considered alongside user activity and the actual economic value the project generates.
ON Price Prediction: Still Bearish or Ready to Rebound?
After such a substantial decline, the possibility of a recovery is naturally a concern for ON holders. However, there is not yet enough evidence to establish whether the price has reached its bottom. The next move is better assessed through several possible scenarios based on market conditions.
Scenario 1: Bearish Pressure Continues
Further declines remain possible if ON fails to hold the US$0.10 area. This could indicate that buyers are still not strong enough to absorb selling pressure.
If weakness continues, the market may seek a new equilibrium at lower prices. The historical low can serve as one reference point, but that does not mean ON is certain to revisit it.
Scenario 2: The Price Moves Sideways
Following a steep decline, ON could also enter a consolidation phase.
In this scenario, prices move within a narrower range as buying and selling activity temporarily find a balance.
Sideways movement may help ease volatility, although it does not necessarily mark the beginning of a recovery. Investors should watch whether ON stops making new lows and begins to show a more stable price structure.
Scenario 3: ON Begins to Rebound
A recovery may occur if selling pressure eases and buyers show renewed interest. A price increase accompanied by stronger trading volume could be one sign that sentiment is starting to shift.
However, not every rebound develops into a sustained uptrend.
A brief rally after a sharp decline may also be driven by short-term trading activity. Confirmation from subsequent price action is therefore still needed.
Read also: PAD Coin Price Prediction: Can Public American Dividend Reach US$1?
Risks of Buying ON Crypto During a Price Decline
A nearly 40% drop in one day may look attractive to investors seeking to buy at lower prices. However, buying during a decline carries its own risks, particularly when there are no clear signs that selling pressure is easing.
Several factors deserve attention before making a decision.
1. Do not focus solely on the decline from the all-time high.
The fact that ON trades far below its peak does not guarantee that further downside is limited. Its value can still change in response to demand and market conditions.
2. Check liquidity conditions.
Spreads and order book depth affect the actual execution price, especially when buying or selling large amounts.
3. Monitor changes in supply.
Changes in circulating supply and vesting schedules can affect trading conditions. However, their impact still depends on token holders' decisions and the level of demand.
4. Avoid impulsive decisions.
Sharp declines often create an urge to buy immediately for fear of missing a rebound. Yet without market confirmation, prices may still fall further.
5. Match your risk exposure to your financial circumstances.
Use an appropriate risk management approach, particularly when considering highly volatile altcoins.
For traders using leverage, large price swings like these also increase the risk of liquidation when prices move against their positions.
If you want to keep up with crypto price movements and the latest market analysis, you can also sign up for Bittime to explore market information and the various digital assets available on the platform.
What Should Investors Watch in ON's Next Price Moves?
After a major correction, ON's price direction will largely depend on how the market responds to recent trading levels. Three factors are worth monitoring over the coming periods.
First, whether the price can hold around US$0.10 or instead forms a new low. Second, how trading volume changes when the price begins to stabilize or attempts a recovery.
Third, whether significant developments in token distribution, ecosystem adoption, or broader altcoin market conditions influence sentiment.
These three indicators should be considered together so that the analysis does not depend on a single price movement.
Conclusion
ON price analysis shows that Orochi Network remains under significant pressure after losing nearly 40% of its value in 24 hours on November 11, 2026.
The decline occurred amid a broader crypto market correction, but ON's losses were much sharper. Liquidity, trading activity, and changes in supply are factors to watch, although there is not yet strong evidence that any one of them was the primary cause.
In the short term, the US$0.10 area is an important price zone to monitor. The prospects for recovery would become more convincing if ON can establish stability and show a sustained increase in demand.
For investors, decisions should be based not only on how far prices have fallen, but also on market conditions, project developments, and the risks that may still emerge.

Bittime is a Digital Financial Asset Trader (PAKD) platform licensed and supervised by Indonesia's Financial Services Authority (OJK) — where you can buy Bitcoin in Indonesia and hundreds of other cryptocurrencies starting from Rp10,000. Registration is fast and secure, and you can get started today.
Track the conversion rate of USDT to IDR and the real-time prices of your favorite cryptocurrencies. Everything is available in one crypto investment app that you can download for free from the Play Store.
Ready to get started? Sign up for Bittime now and put your investment strategy into action on a platform already trusted by millions of users in Indonesia.
FAQ
Why Is the Price of ON Crypto Falling Today?
ON fell nearly 40% in 24 hours, according to observations made on November 11, 2026. The decline points to significant market pressure, but its specific cause cannot be established from price and volume data alone.
Could Orochi Network's Price Fall Further?
Yes. The decline could continue if selling pressure remains high and demand is insufficient to halt the losses. However, the next price movement will depend on market conditions, liquidity, and trading activity.
What Are ON's Support and Resistance Levels?
The US0,099–US0,10 area is the nearest support zone to monitor based on recent prices. Meanwhile, US0,15–US0,17 and US0,19–US0,20 may serve as initial resistance references that still require chart confirmation.
Do Token Unlocks Affect Orochi Network's Price?
Token unlocks can increase available supply and potentially add selling pressure if holders decide to sell. However, there is not enough evidence to establish that unlocks directly caused ON's latest price decline.
Could ON Crypto Rebound in 2026?
A rebound remains possible if prices begin to stabilize and buying activity increases. Nevertheless, a sustained recovery would require support from trading volume, improved market conditions, and developments in the project's fundamentals.
Disclaimer: The views expressed belong exclusively to the author and do not reflect the views of this platform. This platform and its affiliates disclaim any responsibility for the accuracy or suitability of the information provided. It is for informational purposes only and not intended as financial or investment advice.

.png)